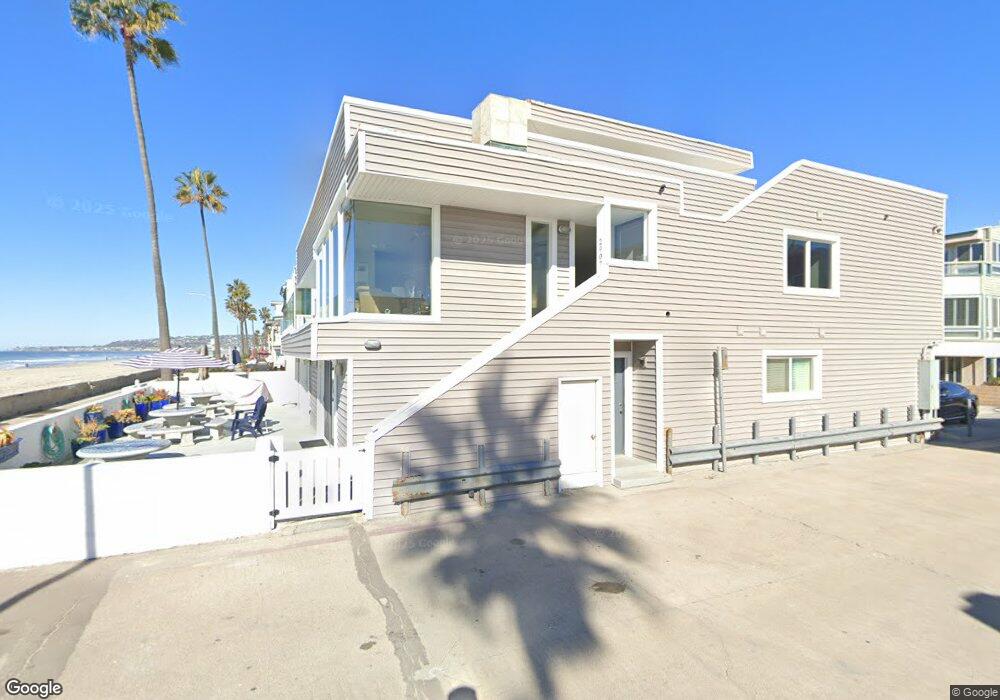
2913 Ocean Front Walk San Diego, CA 92109
Mission Beach NeighborhoodEstimated Value: $2,767,059 - $4,048,000
3
Beds
3
Baths
1,599
Sq Ft
$2,223/Sq Ft
Est. Value
About This Home
This home is located at 2913 Ocean Front Walk, San Diego, CA 92109 and is currently estimated at $3,555,020, approximately $2,223 per square foot. 2913 Ocean Front Walk is a home located in San Diego County with nearby schools including Pacific Beach Elementary School, Pacific Beach Middle, and Mission Bay High School.
Ownership History
Date
Name
Owned For
Owner Type
Purchase Details
Closed on
Oct 16, 2019
Sold by
Jack Bros Inc
Bought by
2913 Ocean Front Llc
Current Estimated Value
Purchase Details
Closed on
Nov 18, 2003
Sold by
Curry Clyde C
Bought by
Jack Bros Inc
Purchase Details
Closed on
Feb 26, 2003
Sold by
Curry Donna L
Bought by
Curry Clyde C
Home Financials for this Owner
Home Financials are based on the most recent Mortgage that was taken out on this home.
Original Mortgage
$720,000
Interest Rate
5.79%
Purchase Details
Closed on
Sep 21, 2001
Sold by
Williams Bruce E and Williams Marna M
Bought by
Curry Clyde C and Curry Donna I
Home Financials for this Owner
Home Financials are based on the most recent Mortgage that was taken out on this home.
Original Mortgage
$500,000
Interest Rate
7.5%
Purchase Details
Closed on
Nov 10, 1993
Sold by
Williams Bruce E and Williams Marna M
Bought by
Williams Bruce E and Williams Marna M
Home Financials for this Owner
Home Financials are based on the most recent Mortgage that was taken out on this home.
Original Mortgage
$375,000
Interest Rate
6.88%
Purchase Details
Closed on
Mar 31, 1989
Create a Home Valuation Report for This Property
The Home Valuation Report is an in-depth analysis detailing your home's value as well as a comparison with similar homes in the area
Home Values in the Area
Average Home Value in this Area
Purchase History
| Date | Buyer | Sale Price | Title Company |
|---|---|---|---|
| 2913 Ocean Front Llc | $2,799,000 | Corinthian Title | |
| Jack Bros Inc | $1,495,000 | Chicago Title Co | |
| Curry Clyde C | -- | Old Republic Title Company | |
| Curry Clyde C | $900,000 | Chicago Title | |
| Williams Bruce E | -- | Westland Title Company | |
| -- | $485,000 | -- |
Source: Public Records
Mortgage History
| Date | Status | Borrower | Loan Amount |
|---|---|---|---|
| Previous Owner | Curry Clyde C | $720,000 | |
| Previous Owner | Curry Clyde C | $500,000 | |
| Previous Owner | Williams Bruce E | $375,000 | |
| Closed | Curry Clyde C | $300,000 | |
| Closed | Curry Clyde C | $60,000 |
Source: Public Records
Tax History Compared to Growth
Tax History
| Year | Tax Paid | Tax Assessment Tax Assessment Total Assessment is a certain percentage of the fair market value that is determined by local assessors to be the total taxable value of land and additions on the property. | Land | Improvement |
|---|---|---|---|---|
| 2025 | $36,898 | $3,061,111 | $2,624,749 | $436,362 |
| 2024 | $36,898 | $3,001,090 | $2,573,284 | $427,806 |
| 2023 | $36,087 | $2,942,246 | $2,522,828 | $419,418 |
| 2022 | $35,127 | $2,884,556 | $2,473,361 | $411,195 |
| 2021 | $34,885 | $2,827,997 | $2,424,864 | $403,133 |
| 2020 | $34,461 | $2,799,000 | $2,400,000 | $399,000 |
| 2019 | $23,775 | $1,926,681 | $1,402,010 | $524,671 |
| 2018 | $22,225 | $1,888,904 | $1,374,520 | $514,384 |
| 2017 | $21,704 | $1,851,868 | $1,347,569 | $504,299 |
| 2016 | $21,362 | $1,815,558 | $1,321,147 | $494,411 |
| 2015 | $20,815 | $1,768,588 | $1,301,303 | $467,285 |
| 2014 | $20,482 | $1,733,945 | $1,275,813 | $458,132 |
Source: Public Records
Map
Nearby Homes
- 2965 Mission Blvd Unit 4C
- 808 Ensenada Ct
- 2999 Mission Blvd Unit 201
- 2820 Bayside Walk Unit 2
- 2808 Bayside Walk Unit B
- 2740 Ocean Front Walk
- 2727 Ocean Front Walk Unit 3
- 2735 Mission Blvd
- 722 San Luis Rey Place Unit 24
- 817 San Luis Rey Place
- 801 Allerton Ct
- 2623 Ocean Front Walk
- 2617 Ocean Front Walk
- 2632 Bayside Walk
- 717 Island Ct
- 728 Jamaica Ct
- 3286-88 Bayside Walk
- 3291 Bayside Walk
- 810 Santa Barbara Place
- 735 Jersey Ct
- 2915 Ocean Front Walk
- 2911 Ocean Front Walk
- 2909 Ocean Front Walk
- 2917 Ocean Front Walk
- 2919 Ocean Front Walk
- 2921 Ocean Front Walk
- 710 San Gabriel Place
- 2907 Ocean Front Walk
- 2905 Ocean Front Walk
- 716 San Gabriel Place
- 715 Devon Ct
- 714 San Gabriel Place
- 704 Devon Ct Unit 10
- 717/719 Devon Ct
- 717/719 Devon Ct
- 717 Devon Ct Unit 19
- 718 San Gabriel Place Unit 20
- 721 Devon Ct
- 728 San Gabriel Place
- 2933 Ocean Front Walk Unit 35