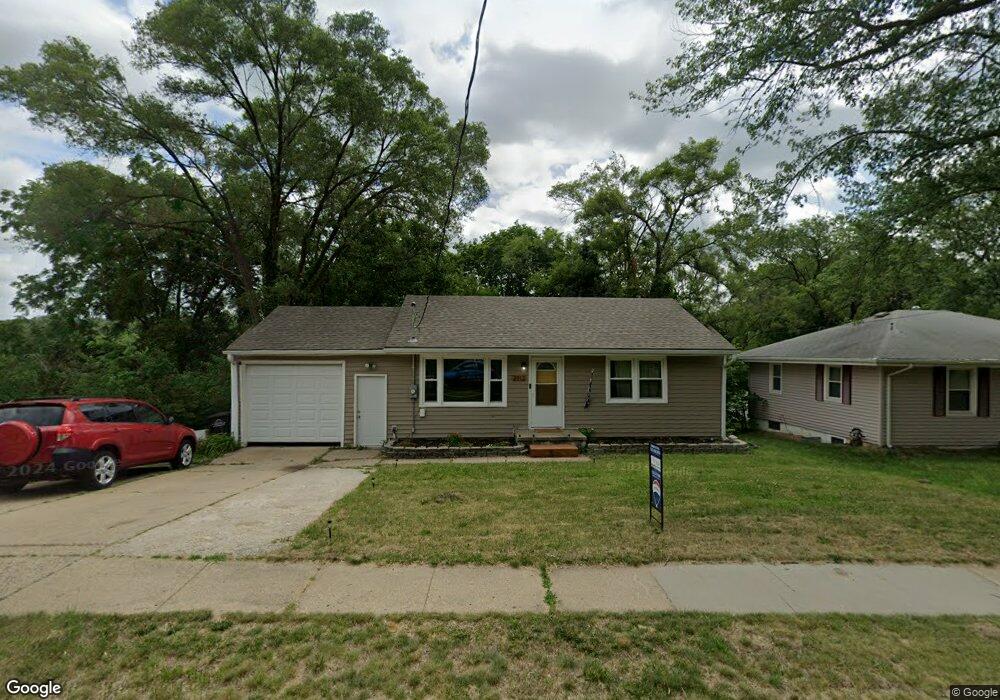
2913 South Union St Des Moines, IA 50315
Indianola Hills NeighborhoodEstimated Value: $158,692 - $177,000
2
Beds
1
Bath
776
Sq Ft
$214/Sq Ft
Est. Value
About This Home
This home is located at 2913 South Union St, Des Moines, IA 50315 and is currently estimated at $166,173, approximately $214 per square foot. 2913 South Union St is a home located in Polk County with nearby schools including Howe Elementary School, Weeks Middle School, and Lincoln High School.
Ownership History
Date
Name
Owned For
Owner Type
Purchase Details
Closed on
Jun 11, 2024
Sold by
Whetstone Zeke A
Bought by
Glawe Christopher
Current Estimated Value
Home Financials for this Owner
Home Financials are based on the most recent Mortgage that was taken out on this home.
Original Mortgage
$141,300
Outstanding Balance
$139,397
Interest Rate
7.09%
Mortgage Type
New Conventional
Estimated Equity
$26,776
Purchase Details
Closed on
Jan 8, 2022
Sold by
Sanders James R
Bought by
Whetstone Zeke A
Home Financials for this Owner
Home Financials are based on the most recent Mortgage that was taken out on this home.
Original Mortgage
$109,267
Interest Rate
3.11%
Mortgage Type
New Conventional
Purchase Details
Closed on
Jun 26, 2019
Sold by
Marcum Erik and Marcum Wendy
Bought by
Sanders James R
Home Financials for this Owner
Home Financials are based on the most recent Mortgage that was taken out on this home.
Original Mortgage
$81,005
Interest Rate
4%
Mortgage Type
FHA
Purchase Details
Closed on
Sep 21, 2005
Sold by
Goode Maurice V and Goode Mary J
Bought by
Marcum Erik
Home Financials for this Owner
Home Financials are based on the most recent Mortgage that was taken out on this home.
Original Mortgage
$78,155
Interest Rate
5.88%
Mortgage Type
FHA
Create a Home Valuation Report for This Property
The Home Valuation Report is an in-depth analysis detailing your home's value as well as a comparison with similar homes in the area
Home Values in the Area
Average Home Value in this Area
Purchase History
| Date | Buyer | Sale Price | Title Company |
|---|---|---|---|
| Glawe Christopher | $157,000 | None Listed On Document | |
| Whetstone Zeke A | $113,000 | None Listed On Document | |
| Sanders James R | $82,500 | None Available | |
| Marcum Erik | $82,000 | -- |
Source: Public Records
Mortgage History
| Date | Status | Borrower | Loan Amount |
|---|---|---|---|
| Open | Glawe Christopher | $141,300 | |
| Previous Owner | Whetstone Zeke A | $109,267 | |
| Previous Owner | Sanders James R | $81,005 | |
| Previous Owner | Marcum Erik | $78,155 |
Source: Public Records
Tax History Compared to Growth
Tax History
| Year | Tax Paid | Tax Assessment Tax Assessment Total Assessment is a certain percentage of the fair market value that is determined by local assessors to be the total taxable value of land and additions on the property. | Land | Improvement |
|---|---|---|---|---|
| 2025 | $2,528 | $138,200 | $24,800 | $113,400 |
| 2024 | $2,528 | $128,500 | $22,600 | $105,900 |
| 2023 | $2,408 | $128,500 | $22,600 | $105,900 |
| 2022 | $2,100 | $102,200 | $18,400 | $83,800 |
| 2021 | $2,014 | $102,200 | $18,400 | $83,800 |
| 2020 | $2,086 | $92,600 | $16,000 | $76,600 |
| 2019 | $2,280 | $92,600 | $16,000 | $76,600 |
| 2018 | $2,024 | $84,800 | $14,400 | $70,400 |
| 2017 | $1,900 | $84,800 | $14,400 | $70,400 |
| 2016 | $1,846 | $78,800 | $13,100 | $65,700 |
| 2015 | $1,846 | $78,800 | $13,100 | $65,700 |
| 2014 | $1,802 | $79,300 | $12,900 | $66,400 |
Source: Public Records
Map
Nearby Homes
- 220 Virginia Ave
- 303 Virginia Ave
- 342 E Pleasant View Dr
- 106 E Creston Ave
- 119 E Park Ave
- 323 E Broad St
- 217 E Park Ave
- 3224 SW 2nd St
- 206 E Hughes Cir
- 3314 S Union St
- 314 E Park Ave
- 80 Lacona Ave
- 612 Creston Ave
- 300 Hughes Ave
- 309 E Park Ave
- 350 E Creston Ave
- 3508 Fairlane Dr
- 2401 Courtland Dr
- 2455 SW 7th St
- 3503 SW 2nd St
- 2913 S Union St
- 2917 South Union St
- 2917 S Union St
- 2921 S Union St
- 5 E Broad St
- 9 E Broad St
- 2921 South Union St
- 15 E Broad St
- 2914 S Union St
- 3001 South Union St
- 2900 South Union St
- 2914 South Union St
- 2822 S Union St
- 2822 South Union St
- 19 E Broad St
- 3005 South Union St
- 3005 S Union St
- 2912 South Union St
- 8 Broad St
- 3000 South Union St