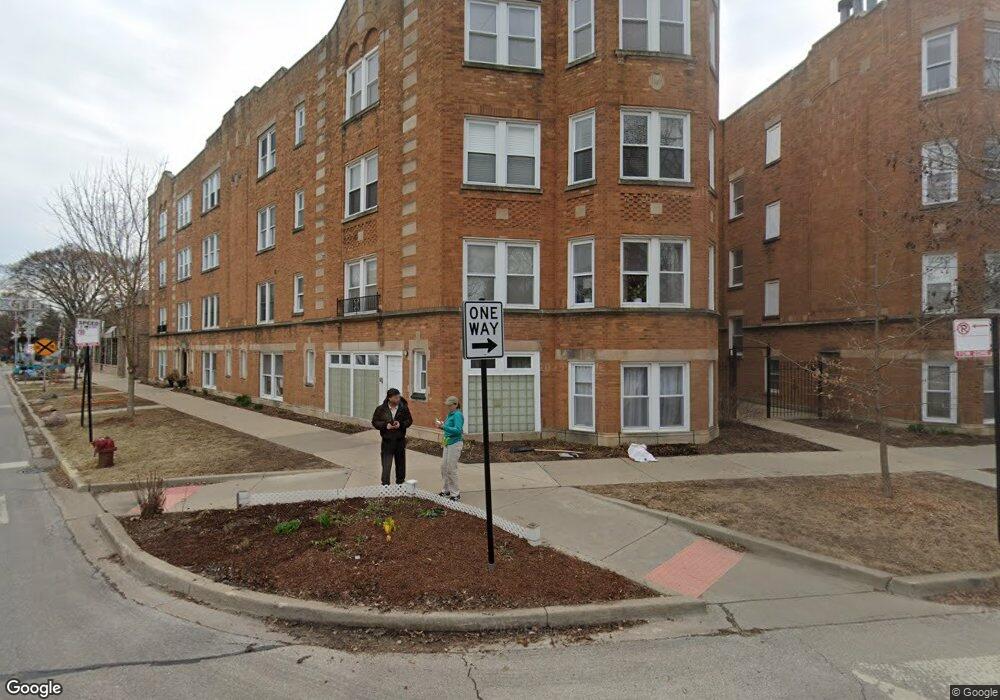
2913 W Leland Ave Unit 2915W2 Chicago, IL 60625
Albany Park NeighborhoodEstimated Value: $326,000 - $393,000
2
Beds
--
Bath
--
Sq Ft
9,191
Sq Ft Lot
About This Home
This home is located at 2913 W Leland Ave Unit 2915W2, Chicago, IL 60625 and is currently estimated at $350,600. 2913 W Leland Ave Unit 2915W2 is a home located in Cook County with nearby schools including Waters Elementary School, Roosevelt High School, and Queen Of Angels Elementary School.
Ownership History
Date
Name
Owned For
Owner Type
Purchase Details
Closed on
Feb 17, 2017
Sold by
Loos Tina
Bought by
Miller Chelsea
Current Estimated Value
Home Financials for this Owner
Home Financials are based on the most recent Mortgage that was taken out on this home.
Original Mortgage
$190,800
Interest Rate
4.16%
Mortgage Type
New Conventional
Purchase Details
Closed on
Sep 17, 2007
Sold by
Keller Beth L and Legate Beth L
Bought by
Loos Tina M
Home Financials for this Owner
Home Financials are based on the most recent Mortgage that was taken out on this home.
Original Mortgage
$195,200
Interest Rate
6.55%
Mortgage Type
Purchase Money Mortgage
Purchase Details
Closed on
May 5, 2000
Sold by
Manor Leland Inc
Bought by
Keller Beth L
Home Financials for this Owner
Home Financials are based on the most recent Mortgage that was taken out on this home.
Original Mortgage
$123,600
Interest Rate
7.62%
Mortgage Type
Purchase Money Mortgage
Create a Home Valuation Report for This Property
The Home Valuation Report is an in-depth analysis detailing your home's value as well as a comparison with similar homes in the area
Home Values in the Area
Average Home Value in this Area
Purchase History
| Date | Buyer | Sale Price | Title Company |
|---|---|---|---|
| Miller Chelsea | $212,000 | Landtrust National Title | |
| Loos Tina M | $244,000 | Pntn | |
| Keller Beth L | $155,000 | -- |
Source: Public Records
Mortgage History
| Date | Status | Borrower | Loan Amount |
|---|---|---|---|
| Previous Owner | Miller Chelsea | $190,800 | |
| Previous Owner | Loos Tina M | $195,200 | |
| Previous Owner | Keller Beth L | $123,600 |
Source: Public Records
Tax History Compared to Growth
Tax History
| Year | Tax Paid | Tax Assessment Tax Assessment Total Assessment is a certain percentage of the fair market value that is determined by local assessors to be the total taxable value of land and additions on the property. | Land | Improvement |
|---|---|---|---|---|
| 2024 | $5,431 | $28,119 | $1,830 | $26,289 |
| 2023 | $5,294 | $25,650 | $1,237 | $24,413 |
| 2022 | $5,294 | $25,650 | $1,237 | $24,413 |
| 2021 | $5,175 | $25,649 | $1,237 | $24,412 |
| 2020 | $4,634 | $20,728 | $1,237 | $19,491 |
| 2019 | $4,609 | $22,865 | $1,237 | $21,628 |
| 2018 | $4,531 | $22,865 | $1,237 | $21,628 |
| 2017 | $3,505 | $19,602 | $1,082 | $18,520 |
| 2016 | $3,437 | $19,602 | $1,082 | $18,520 |
| 2015 | $3,122 | $19,602 | $1,082 | $18,520 |
| 2014 | $2,993 | $18,643 | $1,005 | $17,638 |
| 2013 | $2,923 | $18,643 | $1,005 | $17,638 |
Source: Public Records
Map
Nearby Homes
- 2754 W Giddings St
- 3000 W Lawrence Ave Unit 3H
- 4529 N Mozart St
- 2901 W Sunnyside Ave
- 4752 N Albany Ave Unit 3
- 4750 N Albany Ave Unit 3
- 3113 W Lawrence Ave Unit A301
- 2709 W Lawrence Ave Unit 3
- 3135 W Leland Ave Unit 3W
- 4425 N Sacramento Ave
- 4437 N Whipple St
- 3055 W Sunnyside Ave Unit 1
- 4755 N Washtenaw Ave Unit P-27
- 4755 N Washtenaw Ave Unit P-25
- 4755 N Washtenaw Ave Unit P-11
- 2720 W Gunnison St
- 4411 N Sacramento Ave Unit 1
- 4920 N Whipple St Unit 1
- 2617 W Leland Ave Unit 1
- 4946 N Mozart St
- 2913 W Leland Ave Unit G
- 2913 W Leland Ave Unit 46741
- 2917 W Leland Ave Unit 29173
- 2913 W Leland Ave Unit 29131
- 2913 W Leland Ave Unit 29172
- 2913 W Leland Ave Unit 2913G
- 2913 W Leland Ave Unit 46743
- 2913 W Leland Ave Unit 2915W1
- 2913 W Leland Ave Unit 46723
- 2913 W Leland Ave Unit 2915W3
- 2913 W Leland Ave Unit 2915E2
- 2913 W Leland Ave Unit 2917G
- 2913 W Leland Ave Unit 29132
- 2913 W Leland Ave Unit 29133
- 2913 W Leland Ave Unit 2915E3
- 2913 W Leland Ave Unit 29171
- 2913 W Leland Ave Unit 2915E1
- 2913 W Leland Ave Unit 2
- 2917 W Leland Ave Unit 3
- 2917 W Leland Ave Unit 2