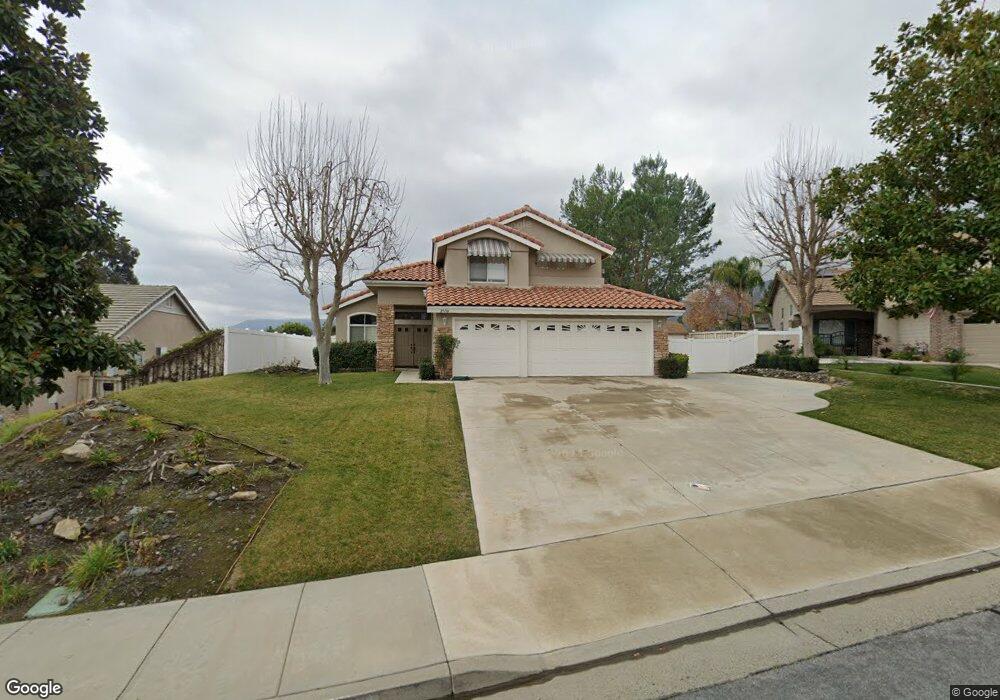
29130 Wayfarer Ct Lake Elsinore, CA 92530
Lake View District NeighborhoodEstimated Value: $663,000 - $693,000
4
Beds
3
Baths
2,285
Sq Ft
$297/Sq Ft
Est. Value
About This Home
This home is located at 29130 Wayfarer Ct, Lake Elsinore, CA 92530 and is currently estimated at $679,377, approximately $297 per square foot. 29130 Wayfarer Ct is a home located in Riverside County with nearby schools including Rice Canyon Elementary School, Terra Cotta Middle School, and Lakeside High School.
Ownership History
Date
Name
Owned For
Owner Type
Purchase Details
Closed on
Mar 22, 2017
Sold by
Johnston Susan L
Bought by
Johnston Susan L
Current Estimated Value
Purchase Details
Closed on
Apr 12, 2000
Sold by
Bosma Hank V and Bosma Susan V
Bought by
Johnston David A and Johnston Susan L
Home Financials for this Owner
Home Financials are based on the most recent Mortgage that was taken out on this home.
Original Mortgage
$180,000
Outstanding Balance
$61,623
Interest Rate
8.22%
Mortgage Type
Purchase Money Mortgage
Estimated Equity
$617,754
Purchase Details
Closed on
Jul 19, 1995
Sold by
Centex Real Estate Corp
Bought by
Bosma Hank and Bosma Susan
Home Financials for this Owner
Home Financials are based on the most recent Mortgage that was taken out on this home.
Original Mortgage
$154,934
Interest Rate
7.51%
Mortgage Type
FHA
Create a Home Valuation Report for This Property
The Home Valuation Report is an in-depth analysis detailing your home's value as well as a comparison with similar homes in the area
Home Values in the Area
Average Home Value in this Area
Purchase History
| Date | Buyer | Sale Price | Title Company |
|---|---|---|---|
| Johnston Susan L | -- | None Available | |
| Johnston David A | $225,000 | First American Title Co | |
| Bosma Hank | $169,500 | First American Title Ins Co |
Source: Public Records
Mortgage History
| Date | Status | Borrower | Loan Amount |
|---|---|---|---|
| Open | Johnston David A | $180,000 | |
| Previous Owner | Bosma Hank | $154,934 |
Source: Public Records
Tax History Compared to Growth
Tax History
| Year | Tax Paid | Tax Assessment Tax Assessment Total Assessment is a certain percentage of the fair market value that is determined by local assessors to be the total taxable value of land and additions on the property. | Land | Improvement |
|---|---|---|---|---|
| 2025 | $3,563 | $352,623 | $76,835 | $275,788 |
| 2023 | $3,563 | $338,932 | $73,852 | $265,080 |
| 2022 | $3,447 | $332,287 | $72,404 | $259,883 |
| 2021 | $3,379 | $325,773 | $70,985 | $254,788 |
| 2020 | $3,344 | $322,434 | $70,258 | $252,176 |
| 2019 | $4,465 | $316,113 | $68,881 | $247,232 |
| 2018 | $4,401 | $309,916 | $67,531 | $242,385 |
| 2017 | $4,338 | $303,840 | $66,207 | $237,633 |
| 2016 | $4,221 | $297,883 | $64,909 | $232,974 |
| 2015 | $4,184 | $293,411 | $63,935 | $229,476 |
| 2014 | $4,544 | $287,666 | $62,684 | $224,982 |
Source: Public Records
Map
Nearby Homes
- 29140 Ocotillo Dr
- 29193 Sunswept Dr
- 29228 Northpointe St
- 15505 Starview St
- 15344 Regatta Way
- 29200 Sandpiper Dr
- 13 Ingall
- 15 Kee Ave
- 15139 Camphor Way
- 143 N Nebraska St
- 32015 Bourges St
- 15062 Amorose St
- 186 S Massachusetts St
- 802 Napa Ct
- 15139 Knollwood St
- 32204 Terra Cotta St
- 29483 Rock Point Dr
- 15026 Navel Way
- 29435 Falling Leaf Dr
- 3329 Spruce St
- 29132 Wayfarer Ct
- 29131 Wayfarer Ct
- 29128 Wayfarer Ct
- 29129 Wayfarer Ct
- 29126 Wayfarer Ct
- 29127 Wayfarer Ct
- 29125 Wayfarer Ct
- 29124 Wayfarer Ct
- 29329 Breakwater St
- 29337 Breakwater St
- 29325 Breakwater St
- 29341 Breakwater St
- 29123 Wayfarer Ct
- 29321 Breakwater St
- 29345 Breakwater St
- 15318 Mesquite Dr
- 15314 Mesquite Dr
- 29122 Wayfarer Ct
- 15322 Mesquite Dr
- 15310 Mesquite Dr