Estimated Value: $420,932 - $501,000
5
Beds
5
Baths
3,045
Sq Ft
$149/Sq Ft
Est. Value
About This Home
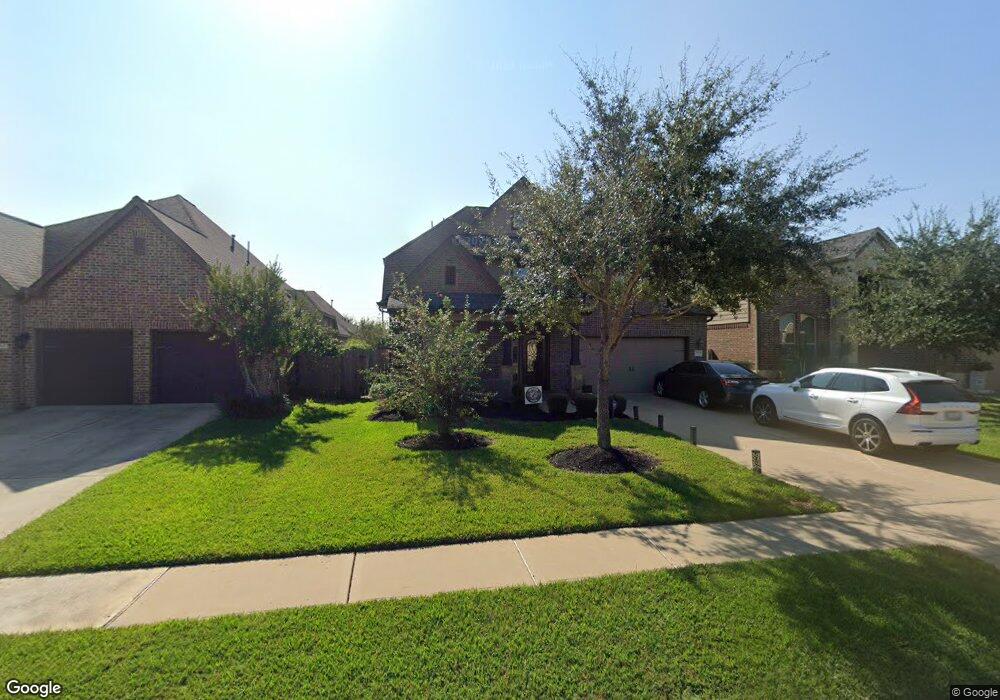
This home is located at 29131 Bentford Manor Ct, Katy, TX 77494 and is currently estimated at $454,483, approximately $149 per square foot. 29131 Bentford Manor Ct is a home with nearby schools including Kathleen Joerger Lindsey Elementary School, Dean Leaman Junior High School, and Fulshear High School.
Ownership History
Date
Name
Owned For
Owner Type
Purchase Details
Closed on
Mar 26, 2015
Sold by
Ravena Homs Llc
Bought by
Ramirez Ramiro A and Valdivia Laura J
Current Estimated Value
Home Financials for this Owner
Home Financials are based on the most recent Mortgage that was taken out on this home.
Original Mortgage
$280,357
Outstanding Balance
$220,284
Interest Rate
4.4%
Mortgage Type
FHA
Estimated Equity
$234,199
Purchase Details
Closed on
Sep 19, 2014
Sold by
Mhi Partnership Ltd
Bought by
Stewart Kevin and Stewart Tehnyia
Home Financials for this Owner
Home Financials are based on the most recent Mortgage that was taken out on this home.
Original Mortgage
$300,722
Interest Rate
4.12%
Mortgage Type
FHA
Purchase Details
Closed on
May 1, 2014
Sold by
Jdc / Firethorne Ltd
Bought by
Stewart Kevin and Stewart Tehnyia
Purchase Details
Closed on
Feb 5, 2014
Sold by
Jdc / Firethorne Ltd
Bought by
Stewart Kevin and Stewart Tehnyia
Create a Home Valuation Report for This Property
The Home Valuation Report is an in-depth analysis detailing your home's value as well as a comparison with similar homes in the area
Home Values in the Area
Average Home Value in this Area
Purchase History
| Date | Buyer | Sale Price | Title Company |
|---|---|---|---|
| Ramirez Ramiro A | -- | None Available | |
| Stewart Kevin | -- | Millennium Title Co | |
| Stewart Kevin | -- | -- | |
| Stewart Kevin | -- | -- |
Source: Public Records
Mortgage History
| Date | Status | Borrower | Loan Amount |
|---|---|---|---|
| Open | Ramirez Ramiro A | $280,357 | |
| Previous Owner | Stewart Kevin | $300,722 |
Source: Public Records
Tax History Compared to Growth
Tax History
| Year | Tax Paid | Tax Assessment Tax Assessment Total Assessment is a certain percentage of the fair market value that is determined by local assessors to be the total taxable value of land and additions on the property. | Land | Improvement |
|---|---|---|---|---|
| 2025 | $8,003 | $435,242 | $64,350 | $370,892 |
| 2024 | $8,003 | $404,080 | $43,367 | $360,713 |
| 2023 | $8,003 | $367,345 | $0 | $383,597 |
| 2022 | $7,695 | $333,950 | $0 | $352,420 |
| 2021 | $7,847 | $303,590 | $45,000 | $258,590 |
| 2020 | $7,950 | $304,310 | $45,000 | $259,310 |
| 2019 | $8,003 | $285,430 | $42,000 | $243,430 |
| 2018 | $8,197 | $289,760 | $42,000 | $247,760 |
| 2017 | $8,225 | $287,180 | $42,000 | $245,180 |
| 2016 | $8,941 | $312,170 | $42,000 | $270,170 |
| 2015 | $5,145 | $308,790 | $42,000 | $266,790 |
| 2014 | $452 | $24,000 | $24,000 | $0 |
Source: Public Records
Map
Nearby Homes
- 29323 Crested Butte Dr
- 29331 Crested Butte Dr
- 2863 Acacia Grove Dr
- 2854 Acacia Grove Dr
- 29350 Dunns Creek Ct
- 3010 Village Creek Dr
- 29114 Davenport Dr
- 29110 Davenport Dr
- 29046 Davenport Dr
- 29011 Oldfield Ct
- 29226 Erica Lee Ct
- 29102 Jarvis Bay Pass
- 29014 Jacobs River Dr
- 29018 Pinnacle Ridge Dr
- 29003 Jacobs River Dr
- 2739 Chestnut Oak Cir
- 29011 Erica Lee Ct
- 3022 Darlington Ct
- 29203 Jacobs River Dr
- 29434 Cherry Vine Rd
- 29127 Bentford Manor Ct
- 29135 Bentford Manor Ct
- 29123 Bentford Manor Ct
- 29202 Crested Butte Dr
- 29154 Crested Butte Dr
- 29139 Bentford Manor Ct
- 29206 Crested Butte Dr
- 29150 Crested Butte Dr
- 29119 Bentford Manor Ct
- 29210 Crested Butte Dr
- 29143 Bentford Manor Ct
- 29146 Crested Butte Dr
- 29130 Bentford Manor Ct
- 29115 Bentford Manor Ct
- 29126 Bentford Manor Ct
- 29134 Bentford Manor Ct Unit 1R & 2R
- 29134 Bentford Manor Ct
- 29214 Crested Butte Dr
- 29122 Bentford Manor Ct
- 29138 Bentford Manor Ct