Estimated Value: $445,000 - $522,000
4
Beds
3
Baths
2,940
Sq Ft
$167/Sq Ft
Est. Value
About This Home
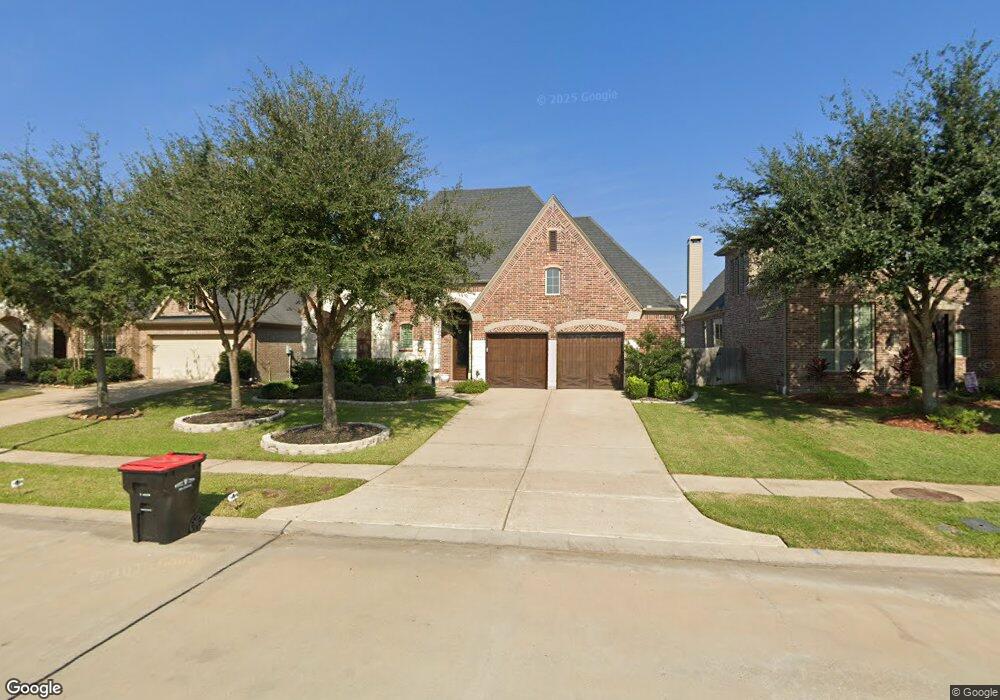
This home is located at 29134 Davenport Dr, Katy, TX 77494 and is currently estimated at $489,795, approximately $166 per square foot. 29134 Davenport Dr is a home located in Fort Bend County with nearby schools including Kathleen Joerger Lindsey Elementary School, Dean Leaman Junior High School, and Fulshear High School.
Ownership History
Date
Name
Owned For
Owner Type
Purchase Details
Closed on
Jul 27, 2017
Sold by
Rivera Javier and Rivera Idelisa S
Bought by
Harris Michael D and Harris Bridgette B
Current Estimated Value
Home Financials for this Owner
Home Financials are based on the most recent Mortgage that was taken out on this home.
Original Mortgage
$317,675
Outstanding Balance
$264,717
Interest Rate
3.91%
Mortgage Type
New Conventional
Estimated Equity
$225,078
Purchase Details
Closed on
Jun 19, 2015
Sold by
Highland Homes Houston Ltd
Bought by
Rivera Javier and Rivera Idelisa S
Home Financials for this Owner
Home Financials are based on the most recent Mortgage that was taken out on this home.
Original Mortgage
$210,000
Interest Rate
3.82%
Mortgage Type
New Conventional
Purchase Details
Closed on
Dec 12, 2014
Sold by
Jdc / Firethorne Ltd
Bought by
Harris Michael D and Harris Bridgette B
Purchase Details
Closed on
Jun 3, 2014
Sold by
Jdc / Firethorne Ltd
Bought by
Harris Michael D and Harris Bridgette B
Create a Home Valuation Report for This Property
The Home Valuation Report is an in-depth analysis detailing your home's value as well as a comparison with similar homes in the area
Home Values in the Area
Average Home Value in this Area
Purchase History
| Date | Buyer | Sale Price | Title Company |
|---|---|---|---|
| Harris Michael D | -- | None Available | |
| Rivera Javier | -- | None Available | |
| Harris Michael D | -- | -- | |
| Harris Michael D | -- | -- | |
| Harris Michael D | -- | -- |
Source: Public Records
Mortgage History
| Date | Status | Borrower | Loan Amount |
|---|---|---|---|
| Open | Harris Michael D | $317,675 | |
| Previous Owner | Harris Michael D | $210,000 |
Source: Public Records
Tax History Compared to Growth
Tax History
| Year | Tax Paid | Tax Assessment Tax Assessment Total Assessment is a certain percentage of the fair market value that is determined by local assessors to be the total taxable value of land and additions on the property. | Land | Improvement |
|---|---|---|---|---|
| 2025 | $9,030 | $462,500 | $67,600 | $394,900 |
| 2024 | $9,030 | $449,430 | $47,320 | $402,110 |
| 2023 | $8,331 | $408,573 | $0 | $438,009 |
| 2022 | $8,614 | $371,430 | $0 | $403,660 |
| 2021 | $8,728 | $337,660 | $52,000 | $285,660 |
| 2020 | $8,464 | $324,000 | $50,000 | $274,000 |
| 2019 | $8,993 | $320,720 | $50,000 | $270,720 |
| 2018 | $9,142 | $323,140 | $50,000 | $273,140 |
| 2017 | $9,207 | $321,460 | $50,000 | $271,460 |
| 2016 | $10,001 | $349,180 | $50,000 | $299,180 |
| 2015 | $1,348 | $71,840 | $47,500 | $24,340 |
Source: Public Records
Map
Nearby Homes
- 29114 Davenport Dr
- 29110 Davenport Dr
- 29226 Erica Lee Ct
- 29046 Davenport Dr
- 29011 Erica Lee Ct
- 29323 Crested Butte Dr
- 29331 Crested Butte Dr
- 2739 Chestnut Oak Cir
- 2863 Acacia Grove Dr
- 2854 Acacia Grove Dr
- 2602 Walnut Crest Dr
- 29018 Pinnacle Ridge Dr
- 2718 Misty Laurel Ct
- 29011 Oldfield Ct
- 29350 Dunns Creek Ct
- 2843 Mcdonough Way
- 29434 Cherry Vine Rd
- 28918 Hollycrest Dr
- 28915 Davenport Dr
- 3010 Village Creek Dr
- 29130 Davenport Dr
- 29202 Davenport Dr
- 29135 Erica Lee Ct
- 29126 Davenport Dr
- 29206 Davenport Dr
- 29131 Erica Lee Ct
- 29203 Erica Lee Ct
- 29127 Erica Lee Ct
- 29207 Erica Lee Ct
- 2802 Crescent Valley Ct
- 29122 Davenport Dr
- 29210 Davenport Dr
- 2803 Crescent Valley Ct
- 29123 Erica Lee Ct
- 29211 Erica Lee Ct
- 2803 Auburn Glade Ct
- 2806 Crescent Valley Ct
- 29118 Davenport Dr
- 29214 Davenport Dr
- 2807 Crescent Valley Ct