Estimated Value: $450,168 - $516,000
3
Beds
2
Baths
2,671
Sq Ft
$176/Sq Ft
Est. Value
About This Home
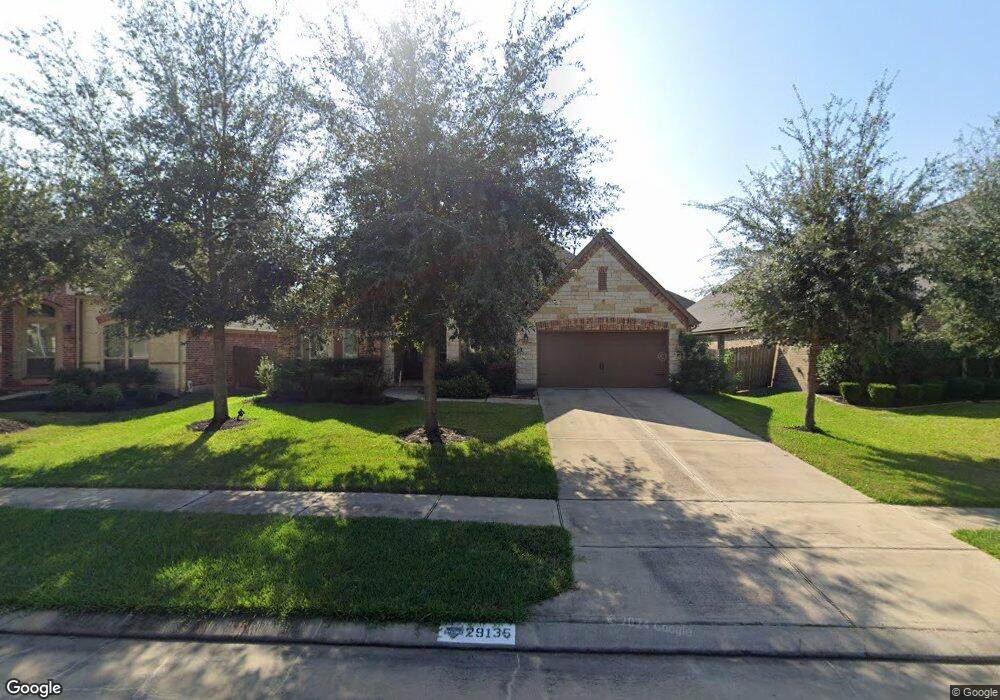
This home is located at 29135 Erica Lee Ct, Katy, TX 77494 and is currently estimated at $470,792, approximately $176 per square foot. 29135 Erica Lee Ct is a home located in Fort Bend County with nearby schools including Kathleen Joerger Lindsey Elementary School, Dean Leaman Junior High School, and Fulshear High School.
Ownership History
Date
Name
Owned For
Owner Type
Purchase Details
Closed on
Feb 9, 2018
Sold by
Eslick Cody Aaron and Eslick Brittanie Nicole
Bought by
Eastwood Mark Edward and Taggart Kaye Ann
Current Estimated Value
Home Financials for this Owner
Home Financials are based on the most recent Mortgage that was taken out on this home.
Original Mortgage
$165,000
Outstanding Balance
$139,740
Interest Rate
3.99%
Mortgage Type
New Conventional
Estimated Equity
$331,052
Purchase Details
Closed on
Aug 20, 2015
Sold by
Ravenna Homes Llc
Bought by
Eslick Aaron and Eslick Brittanie Nicole
Home Financials for this Owner
Home Financials are based on the most recent Mortgage that was taken out on this home.
Original Mortgage
$314,204
Interest Rate
4.08%
Mortgage Type
FHA
Purchase Details
Closed on
May 19, 2015
Sold by
Jdc Firethorne Ltd
Bought by
Ravenna Homes Llc
Purchase Details
Closed on
Jun 3, 2014
Sold by
Jdc / Firethorne Ltd
Bought by
Eslick Cody Aaron and Brittanie Nicole
Create a Home Valuation Report for This Property
The Home Valuation Report is an in-depth analysis detailing your home's value as well as a comparison with similar homes in the area
Home Values in the Area
Average Home Value in this Area
Purchase History
| Date | Buyer | Sale Price | Title Company |
|---|---|---|---|
| Eastwood Mark Edward | -- | Celebrity Title | |
| Eslick Aaron | -- | Attorney | |
| Eslick Cody Aaron | -- | -- | |
| Ravenna Homes Llc | -- | None Available | |
| Eslick Cody Aaron | -- | -- | |
| Eslick Cody Aaron | -- | -- |
Source: Public Records
Mortgage History
| Date | Status | Borrower | Loan Amount |
|---|---|---|---|
| Open | Eastwood Mark Edward | $165,000 | |
| Previous Owner | Eslick Cody Aaron | $314,204 |
Source: Public Records
Tax History Compared to Growth
Tax History
| Year | Tax Paid | Tax Assessment Tax Assessment Total Assessment is a certain percentage of the fair market value that is determined by local assessors to be the total taxable value of land and additions on the property. | Land | Improvement |
|---|---|---|---|---|
| 2025 | $8,481 | $448,300 | $67,600 | $380,700 |
| 2024 | $8,481 | $425,146 | $47,445 | $377,701 |
| 2023 | $7,819 | $386,496 | $0 | $407,499 |
| 2022 | $8,122 | $351,360 | $0 | $386,550 |
| 2021 | $8,256 | $319,420 | $52,000 | $267,420 |
| 2020 | $8,475 | $324,410 | $52,000 | $272,410 |
| 2019 | $8,771 | $312,810 | $50,000 | $262,810 |
| 2018 | $8,768 | $309,940 | $50,000 | $259,940 |
| 2017 | $9,003 | $314,360 | $50,000 | $264,360 |
| 2016 | $9,439 | $329,570 | $50,000 | $279,570 |
| 2015 | $704 | $37,500 | $37,500 | $0 |
Source: Public Records
Map
Nearby Homes
- 29114 Davenport Dr
- 29110 Davenport Dr
- 29226 Erica Lee Ct
- 29046 Davenport Dr
- 29011 Erica Lee Ct
- 29323 Crested Butte Dr
- 29331 Crested Butte Dr
- 2739 Chestnut Oak Cir
- 2863 Acacia Grove Dr
- 2854 Acacia Grove Dr
- 2602 Walnut Crest Dr
- 29018 Pinnacle Ridge Dr
- 2718 Misty Laurel Ct
- 29011 Oldfield Ct
- 29350 Dunns Creek Ct
- 2843 Mcdonough Way
- 29434 Cherry Vine Rd
- 28918 Hollycrest Dr
- 28915 Davenport Dr
- 3010 Village Creek Dr
- 29131 Erica Lee Ct
- 29203 Erica Lee Ct
- 29134 Davenport Dr
- 29127 Erica Lee Ct
- 29207 Erica Lee Ct
- 29202 Davenport Dr
- 29130 Davenport Dr
- 29126 Davenport Dr
- 29206 Davenport Dr
- 29134 Erica Lee Ct
- 29123 Erica Lee Ct
- 29211 Erica Lee Ct
- 29202 Erica Lee Ct
- 29130 Erica Lee Ct
- 29126 Erica Lee Ct
- 29206 Erica Lee Ct
- 29122 Davenport Dr
- 29210 Davenport Dr
- 29119 Erica Lee Ct
- 29215 Erica Lee Ct