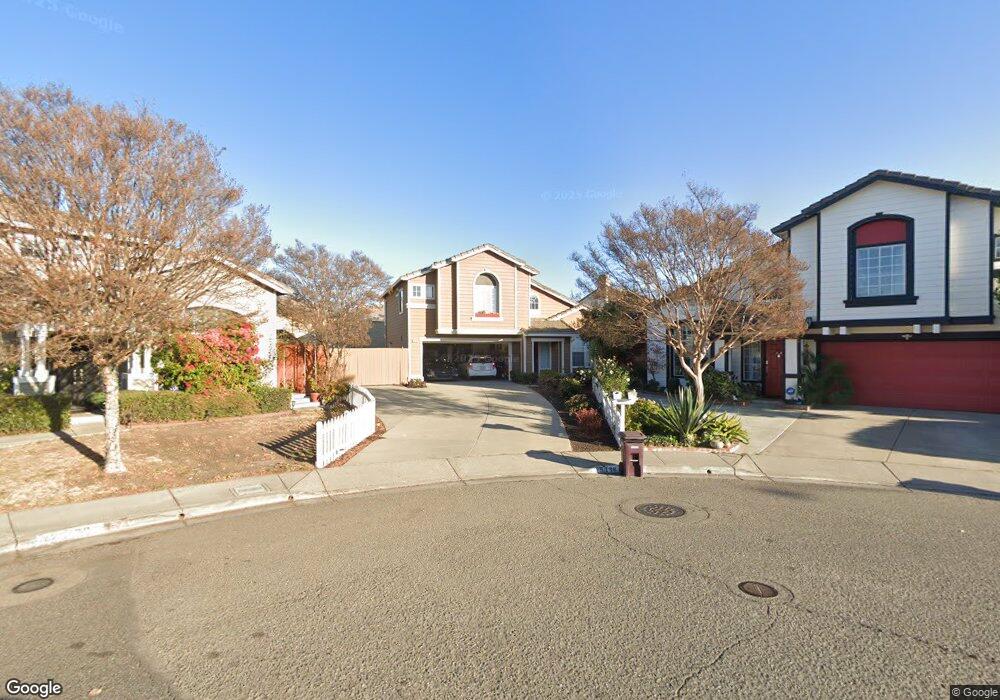
29138 Hillview St Hayward, CA 94544
Tennyson-Alquire NeighborhoodEstimated Value: $988,000 - $1,199,772
4
Beds
3
Baths
1,747
Sq Ft
$602/Sq Ft
Est. Value
About This Home
This home is located at 29138 Hillview St, Hayward, CA 94544 and is currently estimated at $1,052,443, approximately $602 per square foot. 29138 Hillview St is a home located in Alameda County with nearby schools including Ruus Elementary School, Cesar Chavez Middle School, and Tennyson High School.
Ownership History
Date
Name
Owned For
Owner Type
Purchase Details
Closed on
Nov 6, 2020
Sold by
Lew Scott T and Lew Camelia
Bought by
Lew Scott T and Lew Melanie M
Current Estimated Value
Home Financials for this Owner
Home Financials are based on the most recent Mortgage that was taken out on this home.
Original Mortgage
$565,000
Interest Rate
2.7%
Mortgage Type
New Conventional
Purchase Details
Closed on
Sep 11, 2018
Sold by
Lew John W
Bought by
Lew Camelia
Home Financials for this Owner
Home Financials are based on the most recent Mortgage that was taken out on this home.
Original Mortgage
$581,000
Interest Rate
4.6%
Mortgage Type
New Conventional
Purchase Details
Closed on
Sep 10, 2018
Sold by
Sills M Mack and Sills Carol J
Bought by
Lew Scott T and Lew Camelia
Home Financials for this Owner
Home Financials are based on the most recent Mortgage that was taken out on this home.
Original Mortgage
$581,000
Interest Rate
4.6%
Mortgage Type
New Conventional
Purchase Details
Closed on
Apr 4, 1995
Sold by
Kaufman & Broad South Bay Inc
Bought by
Sills M Mack and Sills Carol J
Home Financials for this Owner
Home Financials are based on the most recent Mortgage that was taken out on this home.
Original Mortgage
$184,750
Interest Rate
7.9%
Mortgage Type
Seller Take Back
Create a Home Valuation Report for This Property
The Home Valuation Report is an in-depth analysis detailing your home's value as well as a comparison with similar homes in the area
Home Values in the Area
Average Home Value in this Area
Purchase History
| Date | Buyer | Sale Price | Title Company |
|---|---|---|---|
| Lew Scott T | $282,500 | Boston National Title Co | |
| Lew Camelia | -- | Old Republic Title Company | |
| Lew Scott T | $830,000 | Old Republic Title Company | |
| Sills M Mack | $231,000 | First American Title Guarant |
Source: Public Records
Mortgage History
| Date | Status | Borrower | Loan Amount |
|---|---|---|---|
| Previous Owner | Lew Scott T | $565,000 | |
| Previous Owner | Lew Scott T | $581,000 | |
| Previous Owner | Sills M Mack | $184,750 |
Source: Public Records
Tax History Compared to Growth
Tax History
| Year | Tax Paid | Tax Assessment Tax Assessment Total Assessment is a certain percentage of the fair market value that is determined by local assessors to be the total taxable value of land and additions on the property. | Land | Improvement |
|---|---|---|---|---|
| 2025 | $11,044 | $918,864 | $277,759 | $648,105 |
| 2024 | $11,044 | $900,712 | $272,313 | $635,399 |
| 2023 | $10,877 | $889,917 | $266,975 | $622,942 |
| 2022 | $10,662 | $865,470 | $261,741 | $610,729 |
| 2021 | $10,575 | $848,364 | $256,609 | $598,755 |
| 2020 | $10,455 | $846,600 | $253,980 | $592,620 |
| 2019 | $10,541 | $830,000 | $249,000 | $581,000 |
| 2018 | $4,261 | $337,252 | $100,737 | $236,515 |
| 2017 | $4,164 | $330,641 | $98,763 | $231,878 |
| 2016 | $3,919 | $324,159 | $96,827 | $227,332 |
| 2015 | $3,841 | $319,292 | $95,373 | $223,919 |
| 2014 | $3,652 | $313,039 | $93,505 | $219,534 |
Source: Public Records
Map
Nearby Homes
- 29288 Chance St
- 29138 Delgado Rd
- 29133 De la Cruz Rd
- 37 Lance Way
- 29129 Verdi Rd
- 29129 Verdi Rd Unit 29129
- 29223 Whalebone Way Unit 404
- 29255 Harpoon Way
- 100 Boardwalk Way
- 29300 Dixon St Unit 311
- 29300 Dixon St Unit 106
- 29300 Dixon St Unit 309
- 29235 Lone Tree Place
- 32 Astrida Dr Unit 2
- 552 Celia St
- 28315 Rochelle Ave
- 41 Astrida Dr Unit 9
- 409 Line St
- 260 Industrial Pkwy Unit 47
- 260 Industrial Pkwy Unit 5
- 29146 Hillview St
- 29130 Hillview St
- 11 Folsom Ave
- 33 Folsom Ave
- 29154 Hillview St
- 55 Folsom Ave
- 29122 Hillview St
- 29162 Hillview St
- 29153 Hillview St
- 29114 Hillview St
- 29196 Lassen St
- 29161 Hillview St
- 29187 Delgado Rd
- 100 Folsom Ave
- 29195 Delgado Rd
- 29199 Delgado Rd
- 29106 Hillview St
- 29109 Hillview St
- 29210 Lassen St
- 29108 Lassen St