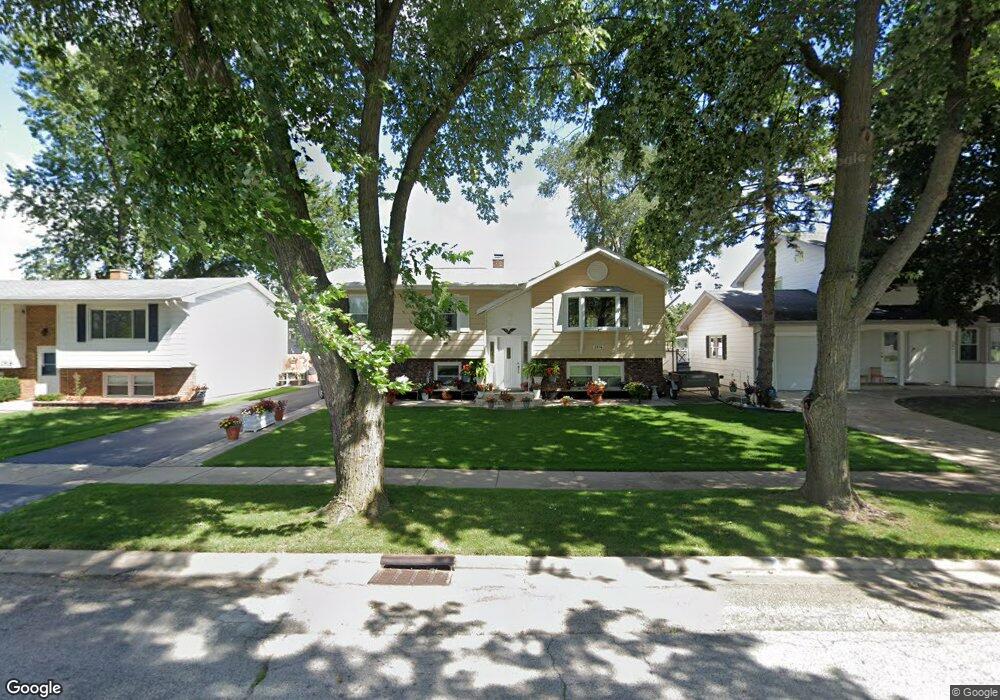
2914 Carriage Ln Waukegan, IL 60085
West Waukegan NeighborhoodEstimated Value: $289,000 - $329,000
3
Beds
2
Baths
1,144
Sq Ft
$269/Sq Ft
Est. Value
About This Home
This home is located at 2914 Carriage Ln, Waukegan, IL 60085 and is currently estimated at $308,042, approximately $269 per square foot. 2914 Carriage Ln is a home located in Lake County with nearby schools including Whittier Elementary School, Robert E. Abbott Middle School, and Waukegan High School.
Ownership History
Date
Name
Owned For
Owner Type
Purchase Details
Closed on
Dec 22, 2015
Sold by
Leal Jesus
Bought by
Vargas Jose and Campos Teresa
Current Estimated Value
Purchase Details
Closed on
Dec 21, 2015
Sold by
Ramirez Jose Carmen Vargas and Cobian Teresa Campos
Bought by
Leal Jesus
Purchase Details
Closed on
Jun 23, 2015
Sold by
Leal Jesus
Bought by
Vargas Jose Carmen and Campos Teresa
Purchase Details
Closed on
Jun 3, 2015
Sold by
Leal Jesus
Bought by
Ramirez Jose Carmen Vargas and Cobian Teresa Campos
Purchase Details
Closed on
Oct 10, 2012
Sold by
Ocon Benito
Bought by
Leal Jesus
Purchase Details
Closed on
May 7, 2003
Sold by
Virden Albert and Virden Deanna
Bought by
Ocon Benito
Home Financials for this Owner
Home Financials are based on the most recent Mortgage that was taken out on this home.
Original Mortgage
$172,600
Interest Rate
5.71%
Mortgage Type
FHA
Create a Home Valuation Report for This Property
The Home Valuation Report is an in-depth analysis detailing your home's value as well as a comparison with similar homes in the area
Home Values in the Area
Average Home Value in this Area
Purchase History
| Date | Buyer | Sale Price | Title Company |
|---|---|---|---|
| Vargas Jose | -- | None Available | |
| Leal Jesus | -- | Attorney | |
| Vargas Jose Carmen | $103,000 | Attorney | |
| Ramirez Jose Carmen Vargas | -- | None Available | |
| Leal Jesus | $65,000 | None Available | |
| Ocon Benito | $179,000 | -- |
Source: Public Records
Mortgage History
| Date | Status | Borrower | Loan Amount |
|---|---|---|---|
| Previous Owner | Ocon Benito | $172,600 |
Source: Public Records
Tax History Compared to Growth
Tax History
| Year | Tax Paid | Tax Assessment Tax Assessment Total Assessment is a certain percentage of the fair market value that is determined by local assessors to be the total taxable value of land and additions on the property. | Land | Improvement |
|---|---|---|---|---|
| 2024 | $6,157 | $90,525 | $12,443 | $78,082 |
| 2023 | $6,584 | $73,290 | $11,140 | $62,150 |
| 2022 | $6,584 | $73,353 | $10,264 | $63,089 |
| 2021 | $5,916 | $62,743 | $8,768 | $53,975 |
| 2020 | $5,785 | $58,452 | $8,168 | $50,284 |
| 2019 | $5,767 | $53,562 | $7,485 | $46,077 |
| 2018 | $5,398 | $49,430 | $9,631 | $39,799 |
| 2017 | $5,204 | $43,732 | $8,521 | $35,211 |
| 2016 | $4,791 | $37,002 | $7,404 | $29,598 |
| 2015 | $5,594 | $33,118 | $6,627 | $26,491 |
| 2014 | $3,383 | $21,503 | $7,283 | $14,220 |
| 2012 | $5,164 | $31,544 | $7,891 | $23,653 |
Source: Public Records
Map
Nearby Homes
- 102 Baldwin Ave
- 3170 W Monroe St Unit 309
- 621 N Austin Ave
- 34887 N Austin Ave
- 603 N Austin Ave
- 24 Washington Terrace
- 0 Brookside Ave
- 12698 W Grandview Ave
- 12716 W Grandview Ave
- 525 Lawrence Ave
- 3210 W Grandview Ave
- 3482 Ellis Ave
- 615 Tiffany Dr
- 2115 Lydia St
- 35400 N Green Bay Rd
- 2726 W Hidden Glen Dr
- 1213 Grand Ave
- 2813 Theresa Ave
- 963 Belle Plaine Ave
- 3409 Glen Flora Ave
- 2918 Carriage Ln
- 2908 Carriage Ln
- 2913 Hyde Park Ave
- 2925 Hyde Park Ave
- 2909 Hyde Park Ave
- 2917 Carriage Ln
- 2917 Carriage Ln
- 2913 Carriage Ln
- 2900 Carriage Ln
- 446 N Frolic Ave
- 2926 Carriage Ln
- 2927 Hyde Park Ave
- 2909 Carriage Ln
- 2905 Hyde Park Ave
- 2921 Carriage Ln
- 2901 Carriage Ln
- 450 N Frolic Ave
- 2929 Hyde Park Ave
- 417 Public Service Rd
- 517 Public Service Ave