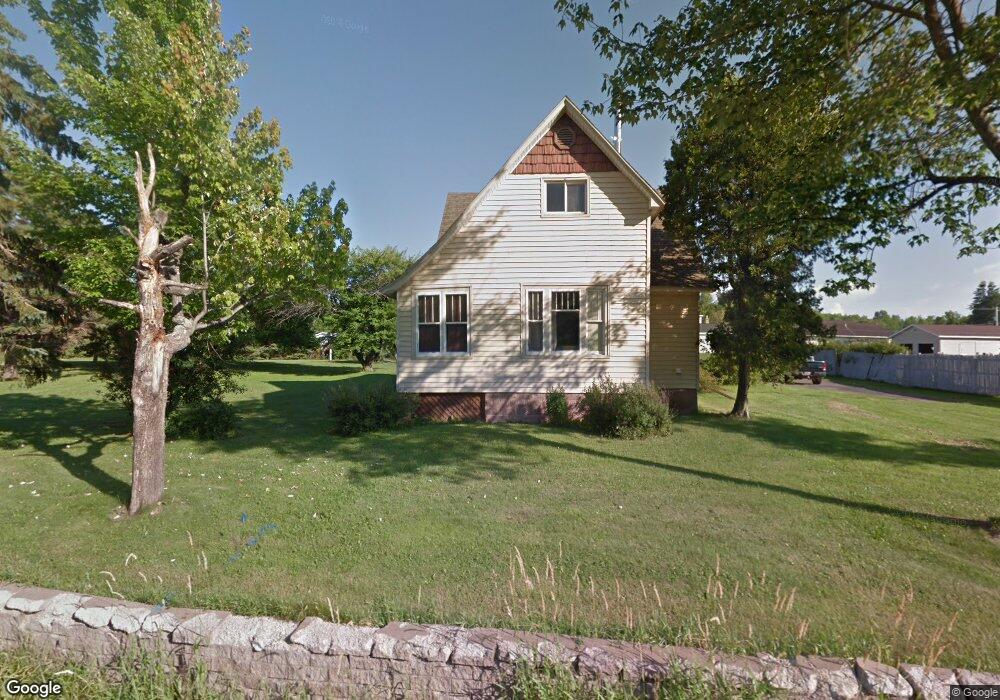
2914 Lake Shore Dr E Ashland, WI 54806
Estimated Value: $67,000 - $119,000
Studio
--
Bath
--
Sq Ft
0.62
Acres Lot
About This Home
This home is located at 2914 Lake Shore Dr E, Ashland, WI 54806 and is currently estimated at $94,819. 2914 Lake Shore Dr E is a home located in Ashland County with nearby schools including Ashland High School, Our Lady Of The Lake Catholic School, and Celebration Christian Academy.
Ownership History
Date
Name
Owned For
Owner Type
Purchase Details
Closed on
Jan 26, 2024
Sold by
Magnuson Mary K
Bought by
Jablonski Zygmund J
Current Estimated Value
Purchase Details
Closed on
Jul 8, 2020
Sold by
Koistinen Wade R and Koistinen Kallie C
Bought by
Friermood Brandon T
Home Financials for this Owner
Home Financials are based on the most recent Mortgage that was taken out on this home.
Original Mortgage
$76,262
Interest Rate
3.1%
Mortgage Type
New Conventional
Purchase Details
Closed on
Dec 27, 2019
Sold by
Kontny Geraldine E
Bought by
Magnuson Mary K
Purchase Details
Closed on
Aug 15, 2016
Sold by
Larson Timothy J
Bought by
Koistinen Wade R and Koistinen Kallie C
Home Financials for this Owner
Home Financials are based on the most recent Mortgage that was taken out on this home.
Original Mortgage
$48,925
Interest Rate
3.41%
Mortgage Type
New Conventional
Create a Home Valuation Report for This Property
The Home Valuation Report is an in-depth analysis detailing your home's value as well as a comparison with similar homes in the area
Home Values in the Area
Average Home Value in this Area
Purchase History
| Date | Buyer | Sale Price | Title Company |
|---|---|---|---|
| Jablonski Zygmund J | $116,800 | Zygmund J Jablonski | |
| Friermood Brandon T | $71,000 | None Available | |
| Magnuson Mary K | $116,800 | Zygmund J Jablonski | |
| Koistinen Wade R | $51,500 | -- |
Source: Public Records
Mortgage History
| Date | Status | Borrower | Loan Amount |
|---|---|---|---|
| Previous Owner | Friermood Brandon T | $76,262 | |
| Previous Owner | Koistinen Wade R | $48,925 |
Source: Public Records
Tax History
| Year | Tax Paid | Tax Assessment Tax Assessment Total Assessment is a certain percentage of the fair market value that is determined by local assessors to be the total taxable value of land and additions on the property. | Land | Improvement |
|---|---|---|---|---|
| 2025 | $1,382 | $46,900 | $23,100 | $23,800 |
| 2024 | $1,285 | $46,900 | $23,100 | $23,800 |
| 2023 | $1,130 | $46,900 | $23,100 | $23,800 |
| 2022 | $1,098 | $46,900 | $23,100 | $23,800 |
| 2021 | $1,047 | $46,900 | $23,100 | $23,800 |
| 2020 | $1,297 | $52,100 | $20,000 | $32,100 |
| 2019 | $1,277 | $52,100 | $20,000 | $32,100 |
| 2018 | $1,223 | $52,100 | $20,000 | $32,100 |
| 2017 | $1,227 | $52,100 | $20,000 | $32,100 |
| 2016 | $1,503 | $61,200 | $20,000 | $41,200 |
| 2015 | $1,503 | $61,200 | $20,000 | $41,200 |
| 2014 | $1,347 | $61,200 | $20,000 | $41,200 |
| 2013 | $1,439 | $61,200 | $20,000 | $41,200 |
Source: Public Records
Map
Nearby Homes
- 2729 Lake Shore Dr E Unit 4
- 000 36th Ave E
- 000 Lake Park Rd
- 14XX Lake Shore Dr E
- 4107 Lake Park Rd
- 515 14th Ave E
- 609 14th Ave E
- 2104 County Highway A
- 506 Willis Ave
- 713 7th Ave E
- 318 2nd Ave E
- 804 Ellis Ave
- 208 3rd Ave W Unit 202
- 208 3rd Ave W Unit 201
- 814 3rd Ave W
- 711 3rd Ave W
- XXX 18th St E
- 812 4th Ave W
- 609 Vaughn Ave
- XXX 22nd St
- 2917 Main St E
- 2913 Main St E
- 2904 Lake Shore Dr E
- 2913 2nd St E
- 2907 Main St E
- 2907 Main St E
- 2901 Main St E
- 3003 Main St E
- 2901 Lake Shore Dr E
- 2906 Main St E
- 0 Old Us 2
- 2902 Main St E
- 110 N 29th Ave E
- 2822 Main St E
- 2816 Main St E
- 611 Main St E
- 71X Main St E Unit 201015640000 & 20101
- 71X Main St E
- 51X Main St E
- 2805 Main St E
Your Personal Tour Guide
Ask me questions while you tour the home.