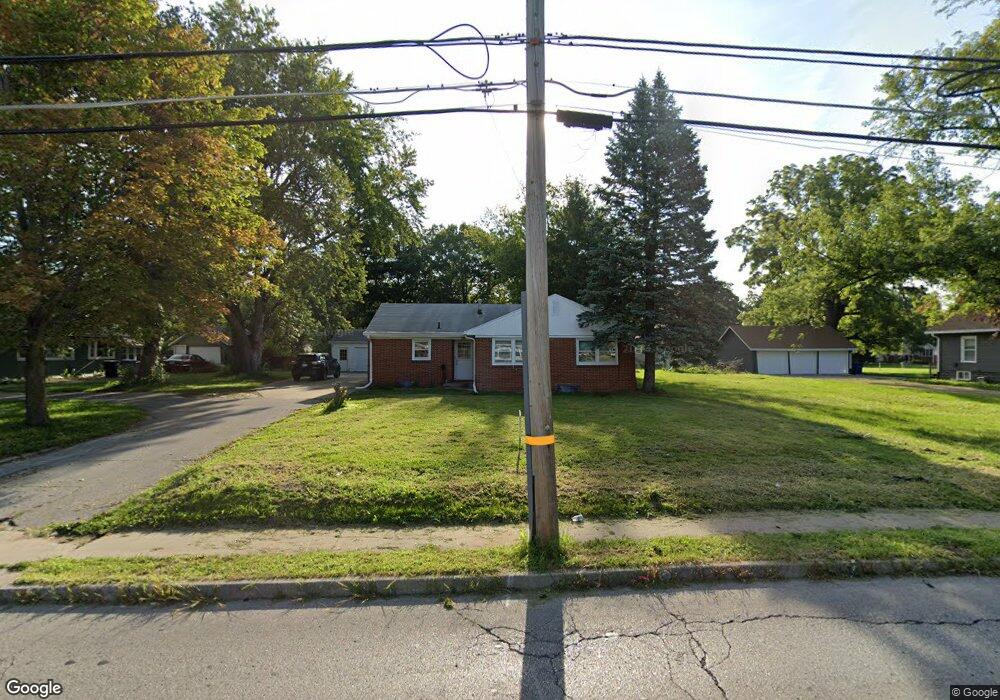
2915 30th St Des Moines, IA 50310
Doudna Heights-Glen Oaks NeighborhoodEstimated Value: $234,000 - $261,000
3
Beds
2
Baths
1,303
Sq Ft
$190/Sq Ft
Est. Value
About This Home
This home is located at 2915 30th St, Des Moines, IA 50310 and is currently estimated at $247,616, approximately $190 per square foot. 2915 30th St is a home located in Polk County with nearby schools including Monroe Elementary School, Meredith Middle School, and Hoover High School.
Ownership History
Date
Name
Owned For
Owner Type
Purchase Details
Closed on
Oct 28, 2015
Sold by
J&M Enterprise Inc
Bought by
Maung Sein Htun
Current Estimated Value
Home Financials for this Owner
Home Financials are based on the most recent Mortgage that was taken out on this home.
Original Mortgage
$117,650
Outstanding Balance
$92,660
Interest Rate
3.91%
Mortgage Type
New Conventional
Estimated Equity
$154,956
Purchase Details
Closed on
Jul 30, 2015
Sold by
Johnson Dorit M
Bought by
J&M Enterprise Inc
Purchase Details
Closed on
Apr 28, 2005
Sold by
Bierwirth Leroy W and Bierwirth Miriam
Bought by
Johanson Dorit M
Create a Home Valuation Report for This Property
The Home Valuation Report is an in-depth analysis detailing your home's value as well as a comparison with similar homes in the area
Home Values in the Area
Average Home Value in this Area
Purchase History
| Date | Buyer | Sale Price | Title Company |
|---|---|---|---|
| Maung Sein Htun | $130,000 | None Available | |
| J&M Enterprise Inc | $125,000 | Attorney | |
| Johanson Dorit M | $134,500 | -- |
Source: Public Records
Mortgage History
| Date | Status | Borrower | Loan Amount |
|---|---|---|---|
| Open | Maung Sein Htun | $117,650 |
Source: Public Records
Tax History Compared to Growth
Tax History
| Year | Tax Paid | Tax Assessment Tax Assessment Total Assessment is a certain percentage of the fair market value that is determined by local assessors to be the total taxable value of land and additions on the property. | Land | Improvement |
|---|---|---|---|---|
| 2025 | $4,244 | $248,000 | $49,800 | $198,200 |
| 2024 | $4,244 | $226,200 | $44,700 | $181,500 |
| 2023 | $4,070 | $226,200 | $44,700 | $181,500 |
| 2022 | $4,038 | $181,600 | $37,400 | $144,200 |
| 2021 | $3,804 | $181,600 | $37,400 | $144,200 |
| 2020 | $3,946 | $161,000 | $32,900 | $128,100 |
| 2019 | $3,518 | $161,000 | $32,900 | $128,100 |
| 2018 | $3,476 | $139,400 | $27,900 | $111,500 |
| 2017 | $3,124 | $139,400 | $27,900 | $111,500 |
| 2016 | $3,038 | $124,000 | $24,300 | $99,700 |
| 2015 | $3,038 | $124,000 | $24,300 | $99,700 |
| 2014 | $2,902 | $117,900 | $22,900 | $95,000 |
Source: Public Records
Map
Nearby Homes
- 3016 30th St
- 2804 Boston Ave
- 3120 30th St
- 3112 Sheridan Ave
- 2620 Arnold Rd
- 2615 30th St
- 2730 Sheridan Ave
- 2904 Shadyoak Dr
- 3301 34th St
- 3405 30th St
- 2701 27th St
- 3109 Holcomb Ave
- 2516 Boston Ave
- 2513 33rd St
- 2823 Holcomb Ave
- 2523 Prospect Rd
- 3501 Sheridan Ave
- 3514 Urbandale Ave
- 2413 Adams Ave
- 3514 Davisson Rd