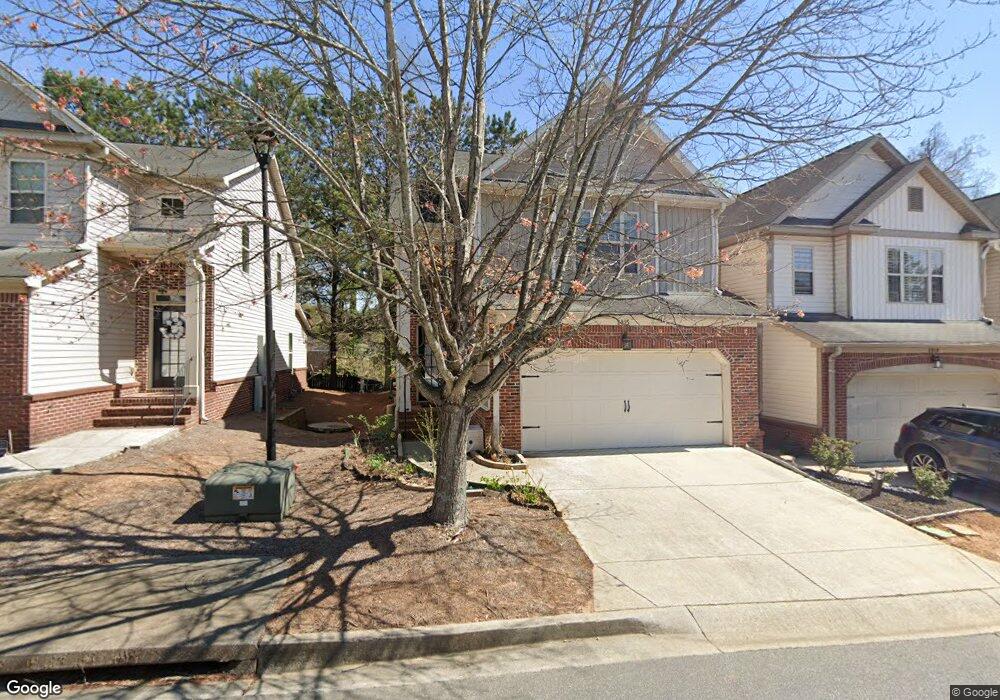
2915 Oshields Ct SW Unit 38 Marietta, GA 30060
Southwestern Marietta NeighborhoodEstimated Value: $325,819 - $384,000
3
Beds
3
Baths
1,810
Sq Ft
$194/Sq Ft
Est. Value
About This Home
This home is located at 2915 Oshields Ct SW Unit 38, Marietta, GA 30060 and is currently estimated at $351,205, approximately $194 per square foot. 2915 Oshields Ct SW Unit 38 is a home located in Cobb County with nearby schools including Norton Park Elementary School, Floyd Middle School, and Osborne High School.
Ownership History
Date
Name
Owned For
Owner Type
Purchase Details
Closed on
Mar 16, 2020
Sold by
Wittkop Sarah E
Bought by
Poulose Polson and Poulose Mary Polson
Current Estimated Value
Home Financials for this Owner
Home Financials are based on the most recent Mortgage that was taken out on this home.
Original Mortgage
$109,500
Interest Rate
3.5%
Mortgage Type
New Conventional
Purchase Details
Closed on
May 4, 2018
Sold by
Taylor Kimberly N
Bought by
Wittkop Sarah E
Home Financials for this Owner
Home Financials are based on the most recent Mortgage that was taken out on this home.
Original Mortgage
$179,450
Interest Rate
4.4%
Mortgage Type
New Conventional
Purchase Details
Closed on
May 12, 2008
Sold by
Red Oak Group Llc
Bought by
Obrien Kimberly N
Home Financials for this Owner
Home Financials are based on the most recent Mortgage that was taken out on this home.
Original Mortgage
$149,150
Interest Rate
5.86%
Mortgage Type
New Conventional
Create a Home Valuation Report for This Property
The Home Valuation Report is an in-depth analysis detailing your home's value as well as a comparison with similar homes in the area
Home Values in the Area
Average Home Value in this Area
Purchase History
| Date | Buyer | Sale Price | Title Company |
|---|---|---|---|
| Poulose Polson | $219,000 | None Available | |
| Wittkop Sarah E | $185,000 | -- | |
| Obrien Kimberly N | $157,000 | -- |
Source: Public Records
Mortgage History
| Date | Status | Borrower | Loan Amount |
|---|---|---|---|
| Previous Owner | Poulose Polson | $109,500 | |
| Previous Owner | Wittkop Sarah E | $179,450 | |
| Previous Owner | Obrien Kimberly N | $149,150 |
Source: Public Records
Tax History Compared to Growth
Tax History
| Year | Tax Paid | Tax Assessment Tax Assessment Total Assessment is a certain percentage of the fair market value that is determined by local assessors to be the total taxable value of land and additions on the property. | Land | Improvement |
|---|---|---|---|---|
| 2025 | $1,020 | $134,516 | $26,000 | $108,516 |
| 2024 | $978 | $119,628 | $19,200 | $100,428 |
| 2023 | $772 | $119,628 | $19,200 | $100,428 |
| 2022 | $920 | $100,264 | $19,200 | $81,064 |
| 2021 | $870 | $83,344 | $16,000 | $67,344 |
| 2020 | $2,529 | $83,344 | $16,000 | $67,344 |
| 2019 | $2,204 | $72,608 | $16,000 | $56,608 |
| 2018 | $1,707 | $66,552 | $16,000 | $50,552 |
| 2017 | $1,539 | $62,628 | $12,000 | $50,628 |
| 2016 | $1,430 | $58,632 | $12,800 | $45,832 |
| 2015 | $1,118 | $46,792 | $14,400 | $32,392 |
| 2014 | $1,128 | $46,792 | $0 | $0 |
Source: Public Records
Map
Nearby Homes
- 2896 Oshields Ct SW Unit 1
- 2946 Oshields Ct SW Unit 3
- 2777 Northwood Ct SW
- 2896 Lakemont Dr SW
- 2898 Lakemont Dr SW
- 174 Timber Creek Ln SW Unit 176
- 154 Timber Creek Ln SW Unit 1
- 51 Overbrook Dr SE Unit 3
- 61 Overbrook Dr SE
- 33 Smyrna Powder Springs Rd SE
- 3175 Foxwood Trail SE
- 2621 Walton Way SW
- 54 Church Rd SE Unit 1
- 3090 Moser Way
- 3306 Harrow Ct SW
- 430 Church Rd SW
- 571 Norton Cir SE
- 370 Kenmure Ct
- 264 Rockin Hill Dr SW
- 85 Smyrna Powder Springs Rd SE
- 2915 Oshields Ct SW Unit 6
- 2919 O Shields Ct SW Unit 37
- 2919 Oshields Ct SW Unit 6
- 2919 Oshields Ct SW Unit 37
- 2923 O'Shields Ct SW Unit 6
- 2909 Oshields Ct SW Unit 7
- 2909 Oshields Ct SW
- 2923 Oshields Ct SW Unit 6
- 2923 Oshields Ct SW Unit 6
- 2923 Oshields Ct SW
- 2905 Oshields Ct SW Unit 7
- 2927 O'Shields Ct SW
- 2927 O'Shields Ct SW
- 2927 O Shields Ct SW Unit 35
- 2927 Oshields Ct SW Unit 35
- 2927 Oshields Ct SW Unit 6
- 2927 Oshields Ct SW
- O O'Shields Ct SW
- O O'Shields Ct SW Unit 4
- 2901 Oshields Ct SW Unit 7