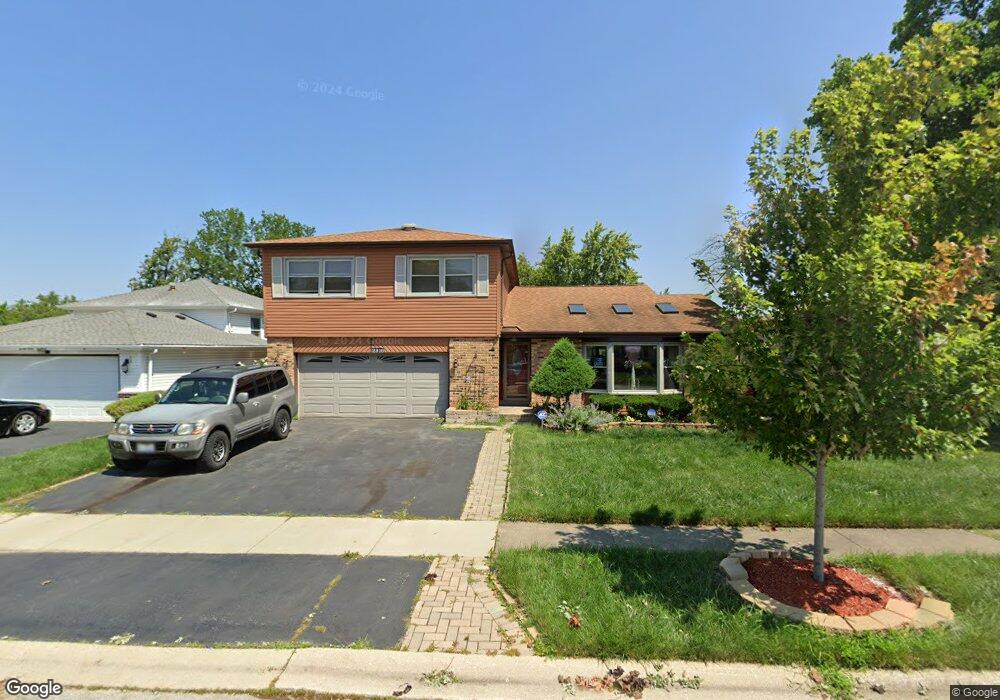
2916 Buttonwood Walk Hazel Crest, IL 60429
Stonebridge NeighborhoodEstimated Value: $268,000 - $347,000
4
Beds
3
Baths
2,179
Sq Ft
$142/Sq Ft
Est. Value
About This Home
This home is located at 2916 Buttonwood Walk, Hazel Crest, IL 60429 and is currently estimated at $308,825, approximately $141 per square foot. 2916 Buttonwood Walk is a home located in Cook County with nearby schools including Mae Jemison School, Prairie-Hills Junior High School, and Hillcrest High School.
Ownership History
Date
Name
Owned For
Owner Type
Purchase Details
Closed on
Aug 1, 2014
Sold by
Wiseman Isaac R and Wiseman Nicole V
Bought by
Wiseman Trust
Current Estimated Value
Purchase Details
Closed on
Aug 7, 2003
Sold by
Isaac Frank and Isaac Edith
Bought by
Wiseman Isaac R
Home Financials for this Owner
Home Financials are based on the most recent Mortgage that was taken out on this home.
Original Mortgage
$137,700
Outstanding Balance
$64,239
Interest Rate
6.44%
Mortgage Type
Unknown
Estimated Equity
$244,586
Purchase Details
Closed on
Jan 7, 1999
Sold by
Isaac Edith
Bought by
Isaac Franck
Home Financials for this Owner
Home Financials are based on the most recent Mortgage that was taken out on this home.
Original Mortgage
$104,250
Interest Rate
6.79%
Purchase Details
Closed on
May 26, 1994
Sold by
Isaac Frank and Isaac Edith
Bought by
Isaac Frank and Isaac Edith
Create a Home Valuation Report for This Property
The Home Valuation Report is an in-depth analysis detailing your home's value as well as a comparison with similar homes in the area
Home Values in the Area
Average Home Value in this Area
Purchase History
| Date | Buyer | Sale Price | Title Company |
|---|---|---|---|
| Wiseman Trust | -- | None Available | |
| Wiseman Isaac R | $162,000 | Pntn | |
| Isaac Franck | -- | -- | |
| Isaac Frank | -- | -- |
Source: Public Records
Mortgage History
| Date | Status | Borrower | Loan Amount |
|---|---|---|---|
| Open | Wiseman Isaac R | $137,700 | |
| Previous Owner | Isaac Franck | $104,250 |
Source: Public Records
Tax History Compared to Growth
Tax History
| Year | Tax Paid | Tax Assessment Tax Assessment Total Assessment is a certain percentage of the fair market value that is determined by local assessors to be the total taxable value of land and additions on the property. | Land | Improvement |
|---|---|---|---|---|
| 2024 | $11,281 | $26,001 | $2,984 | $23,017 |
| 2023 | $6,614 | $26,001 | $2,984 | $23,017 |
| 2022 | $6,614 | $13,116 | $2,633 | $10,483 |
| 2021 | $6,451 | $13,114 | $2,632 | $10,482 |
| 2020 | $6,309 | $13,114 | $2,632 | $10,482 |
| 2019 | $7,188 | $14,851 | $2,457 | $12,394 |
| 2018 | $6,961 | $14,851 | $2,457 | $12,394 |
| 2017 | $6,547 | $14,851 | $2,457 | $12,394 |
| 2016 | $5,823 | $13,171 | $2,106 | $11,065 |
| 2015 | $5,908 | $13,171 | $2,106 | $11,065 |
| 2014 | $5,792 | $13,171 | $2,106 | $11,065 |
| 2013 | $5,667 | $14,462 | $2,106 | $12,356 |
Source: Public Records
Map
Nearby Homes
- 2908 Buttonwood Walk
- 17804 Pebblewood Ln
- 17714 Dogwood Ln
- 17803 Dogwood Ln
- 17805 Dogwood Ln
- 17622 Oakwood Dr
- 17613 Grandview Dr
- 5 E Carriageway Dr Unit 210
- 2805 Knollwood Place
- 3111 Smoke Tree Ct
- 7 E Carriageway Dr Unit 311
- 17910 Millstone Rd
- 2722 Cherrywood Ln
- 2711 Larkspur Ln
- 18024 Marlin Ln
- 2912 175th St
- 2612 Turtle Creek Dr
- 2900 175th St
- 17405 Longfellow Ave
- 17504 Danielle Ct
- 2918 Buttonwood Walk
- 2914 Buttonwood Walk
- 17809 Oakwood Dr
- 17807 Oakwood Dr
- 2920 Buttonwood Walk
- 2912 Buttonwood Walk
- 17811 Oakwood Dr
- 2911 Buttonwood Walk
- 2909 Buttonwood Walk
- 17805 Oakwood Dr
- 3000 Buttonwood Walk
- 2907 Buttonwood Walk
- 17813 Oakwood Dr
- 2910 Buttonwood Walk
- 2915 Buttonwood Walk
- 17803 Oakwood Dr
- 3002 Buttonwood Walk
- 3001 Buttonwood Walk
- 2914 Greenwood Rd