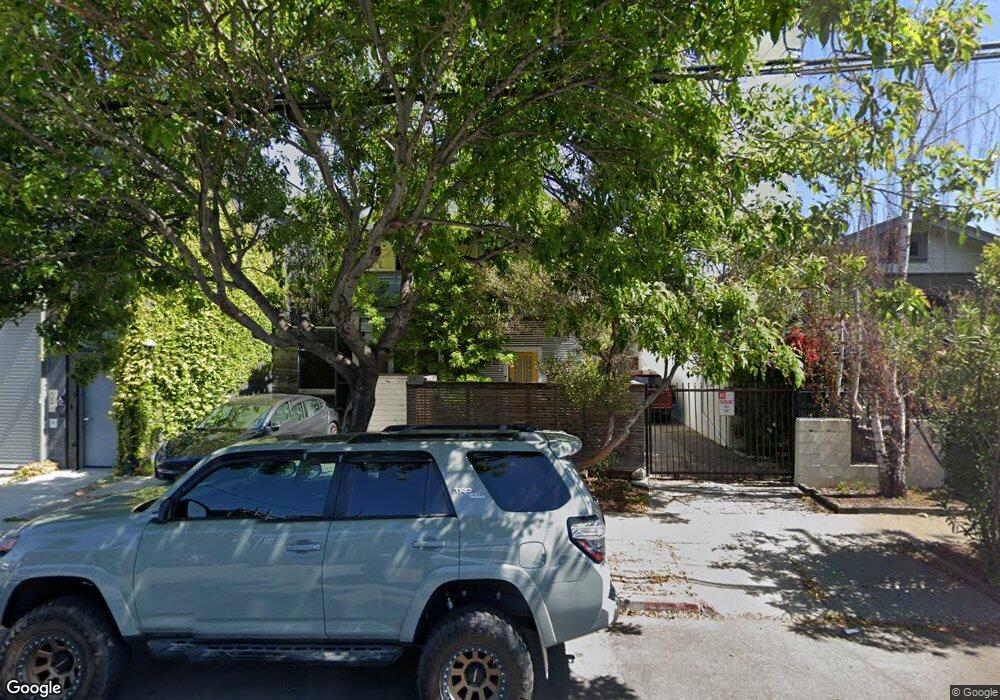
2916 Chapman St Oakland, CA 94601
Jingletown NeighborhoodEstimated Value: $375,000 - $842,000
2
Beds
2
Baths
723
Sq Ft
$959/Sq Ft
Est. Value
About This Home
This home is located at 2916 Chapman St, Oakland, CA 94601 and is currently estimated at $693,163, approximately $958 per square foot. 2916 Chapman St is a home located in Alameda County with nearby schools including International Community, Think College Now, and Urban Promise Academy.
Ownership History
Date
Name
Owned For
Owner Type
Purchase Details
Closed on
May 8, 2018
Sold by
Parish Susan M and Moyski Susan M
Bought by
Wilson Charles R
Current Estimated Value
Home Financials for this Owner
Home Financials are based on the most recent Mortgage that was taken out on this home.
Original Mortgage
$563,500
Outstanding Balance
$485,639
Interest Rate
4.44%
Mortgage Type
New Conventional
Estimated Equity
$207,524
Purchase Details
Closed on
Sep 15, 2015
Sold by
Parish Susan M and Moyski Susan M
Bought by
Parish Susan M and Moyski Susan M
Home Financials for this Owner
Home Financials are based on the most recent Mortgage that was taken out on this home.
Original Mortgage
$112,000
Interest Rate
3.9%
Mortgage Type
New Conventional
Purchase Details
Closed on
Feb 24, 1995
Sold by
Ramirez Humberto and Ramirez Rebecca
Bought by
Parish Susan M and Moyski Susan M
Home Financials for this Owner
Home Financials are based on the most recent Mortgage that was taken out on this home.
Original Mortgage
$44,200
Interest Rate
9.23%
Create a Home Valuation Report for This Property
The Home Valuation Report is an in-depth analysis detailing your home's value as well as a comparison with similar homes in the area
Home Values in the Area
Average Home Value in this Area
Purchase History
| Date | Buyer | Sale Price | Title Company |
|---|---|---|---|
| Wilson Charles R | $805,000 | First American Title Company | |
| Parish Susan M | -- | Placer Title Company | |
| Parish Susan M | $59,000 | American Title Insurance Co |
Source: Public Records
Mortgage History
| Date | Status | Borrower | Loan Amount |
|---|---|---|---|
| Open | Wilson Charles R | $563,500 | |
| Previous Owner | Parish Susan M | $112,000 | |
| Previous Owner | Parish Susan M | $44,200 |
Source: Public Records
Tax History
| Year | Tax Paid | Tax Assessment Tax Assessment Total Assessment is a certain percentage of the fair market value that is determined by local assessors to be the total taxable value of land and additions on the property. | Land | Improvement |
|---|---|---|---|---|
| 2025 | $12,838 | $908,936 | $274,781 | $641,155 |
| 2024 | $12,838 | $890,977 | $269,393 | $628,584 |
| 2023 | $13,542 | $880,371 | $264,111 | $616,260 |
| 2022 | $13,217 | $856,112 | $258,933 | $604,179 |
| 2021 | $12,707 | $839,191 | $253,857 | $592,334 |
| 2020 | $12,807 | $837,521 | $251,256 | $586,265 |
| 2019 | $12,396 | $821,100 | $246,330 | $574,770 |
| 2018 | $2,777 | $139,069 | $26,128 | $112,941 |
| 2017 | $2,629 | $136,343 | $25,616 | $110,727 |
| 2016 | $2,571 | $133,669 | $25,113 | $108,556 |
| 2015 | $2,672 | $131,662 | $24,736 | $106,926 |
| 2014 | $2,601 | $129,084 | $24,252 | $104,832 |
Source: Public Records
Map
Nearby Homes
- 2853 Regatta Dr Unit 179
- 2875 Glascock St Unit 209
- 3090 Glascock St Unit 102
- 340 29th Ave Unit 204
- 3109 Elmwood Ave
- 2745 E 10th St
- 1021 Santa Ines Ct
- 2701 E 9th St
- 2736 E 10th St
- 827 34th Ave
- 2635 E 10th St
- 1208 31st Ave
- 3338 San Leandro St
- 1009 36th Ave
- 2932 Marina Dr
- 3314 Farnam St
- 2560 International Blvd
- 1464 35th Ave
- 1601 Broadway Unit 9
- 3701 International Blvd
- 2920 Chapman St
- 2915 E 7th St
- 2925 E 7th St
- 2932 Chapman St
- 2940 Chapman St
- 2941 E 7th St
- 2891 E 7th St
- 2947 E 7th St
- 2885 E 7th St
- 2951 E 7th St
- 2877 E 7th St
- 2922 E 7th St
- 2957 E 7th St
- 2932 E 7th St
- 2938 E 7th St
- 2871 E 7th St
- 2942 E 7th St
- 705 Peterson St
- 2883 Chapman St
- 2934 Ford St Unit Ford Street Studios
Your Personal Tour Guide
Ask me questions while you tour the home.