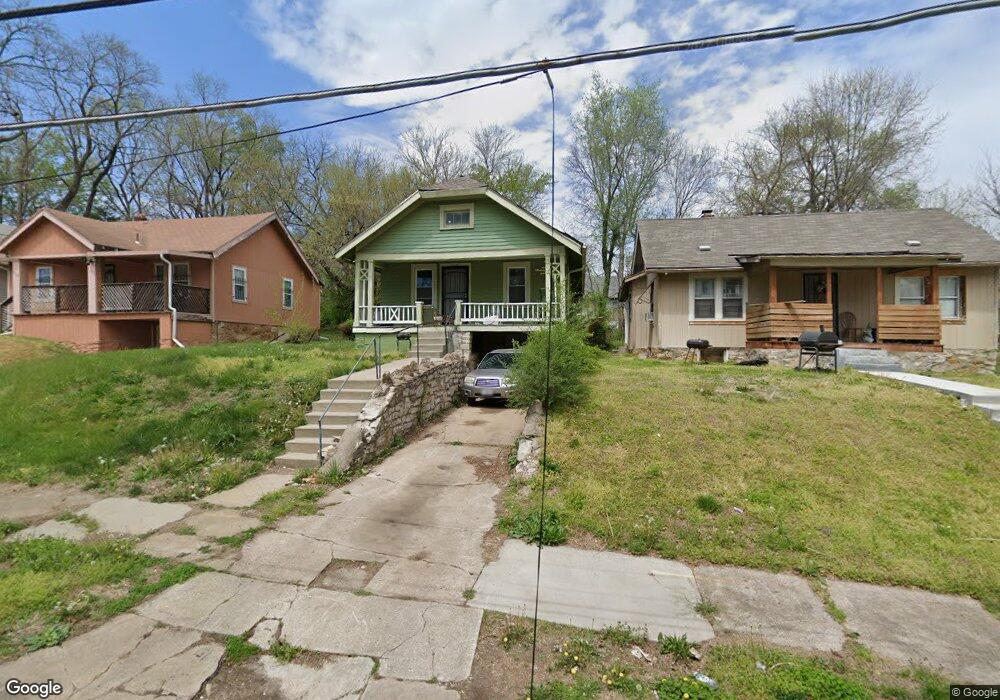
2916 E 69th St Kansas City, MO 64132
Estimated Value: $57,000 - $166,000
2
Beds
1
Bath
704
Sq Ft
$151/Sq Ft
Est. Value
About This Home
This home is located at 2916 E 69th St, Kansas City, MO 64132 and is currently estimated at $106,333, approximately $151 per square foot. 2916 E 69th St is a home located in Jackson County with nearby schools including Benjamin Banneker Elementary School, Central Middle School, and Southeast High School.
Ownership History
Date
Name
Owned For
Owner Type
Purchase Details
Closed on
Mar 23, 2017
Sold by
Mitchell Sallie
Bought by
Burrell Floyd L
Current Estimated Value
Purchase Details
Closed on
Mar 3, 2017
Sold by
Burrell Floyd L
Bought by
Push Miles Investment Corp
Purchase Details
Closed on
Oct 3, 2016
Sold by
Mitchell Sallie
Bought by
Burrell Floyd L
Purchase Details
Closed on
Jul 12, 2013
Sold by
Anderson Annie M
Bought by
Mitchell Sallie
Home Financials for this Owner
Home Financials are based on the most recent Mortgage that was taken out on this home.
Original Mortgage
$13,300
Interest Rate
10%
Mortgage Type
New Conventional
Purchase Details
Closed on
Mar 10, 2009
Sold by
Thompson Kimberly
Bought by
Anderson Annie M
Create a Home Valuation Report for This Property
The Home Valuation Report is an in-depth analysis detailing your home's value as well as a comparison with similar homes in the area
Home Values in the Area
Average Home Value in this Area
Purchase History
| Date | Buyer | Sale Price | Title Company |
|---|---|---|---|
| Burrell Floyd L | -- | None Available | |
| Push Miles Investment Corp | $25,000 | None Available | |
| Burrell Floyd L | -- | None Available | |
| Mitchell Sallie | -- | Alpha Title Llc | |
| Anderson Annie M | -- | None Available |
Source: Public Records
Mortgage History
| Date | Status | Borrower | Loan Amount |
|---|---|---|---|
| Previous Owner | Mitchell Sallie | $13,300 |
Source: Public Records
Tax History Compared to Growth
Tax History
| Year | Tax Paid | Tax Assessment Tax Assessment Total Assessment is a certain percentage of the fair market value that is determined by local assessors to be the total taxable value of land and additions on the property. | Land | Improvement |
|---|---|---|---|---|
| 2025 | $493 | $5,778 | $1,311 | $4,467 |
| 2024 | $488 | $6,243 | $1,167 | $5,076 |
| 2023 | $488 | $6,244 | $671 | $5,573 |
| 2022 | $359 | $4,370 | $1,378 | $2,992 |
| 2021 | $358 | $4,370 | $1,378 | $2,992 |
| 2020 | $366 | $4,413 | $1,378 | $3,035 |
| 2019 | $359 | $4,413 | $1,378 | $3,035 |
| 2018 | $353 | $4,434 | $648 | $3,786 |
| 2017 | $353 | $4,434 | $648 | $3,786 |
| 2016 | $346 | $4,323 | $498 | $3,825 |
| 2014 | $347 | $4,323 | $498 | $3,825 |
Source: Public Records
Map
Nearby Homes
- 6823 S Benton Ave
- 6815 S Benton Ave
- 6947 Bellefontaine Ave
- 6933 Walrond Ave
- 3114 E 68th St
- 6727 Agnes Ave
- 7013 Bellefontaine Ave
- 6942 College Ave
- 7012 S Benton Ave
- 6721 S Benton Ave
- 7040 Agnes Ave
- 7015 College Ave
- 6701 Walrond Ave
- 7103 Agnes Ave
- 7115 Bellefontaine Ave
- 6821 Bales Ave
- 7119 Bellefontaine Ave
- 6727 Bales Ave
- 2422 E 70th Terrace
- 3503 E 67th St
- 2920 E 69th St
- 2912 E 69th St
- 2908 E 69th St
- 6836 Agnes Ave
- 6900 Agnes Ave
- 6834 Agnes Ave
- 2904 E 69th St
- 3000 E 69th St
- 6902 Agnes Ave
- 6901 Agnes Ave
- 3004 E 69th St
- 6830 Agnes Ave
- 2900 E 69th St
- 6908 Agnes Ave
- 6837 Agnes Ave
- 6905 Agnes Ave
- 6833 Agnes Ave
- 6828 Agnes Ave
- 3006 E 69th St
- 6905 S Benton Ave