NOT LISTED FOR SALE

2916 N St Philomena Ct Peoria, IL 61604

West Bluff Neighborhood

Estimated Value: $85,000 - $113,000

3 Beds
1 Bath
1,004 Sq Ft
$100/Sq Ft Est. Value

Last Sold November 26, 2014

Last sale price $56,000 $56 Per Sq Ft

Est. 86% increase in value since last sale

Current estimated payment $674/month

49 Days on Market

Highlights

  • Ranch Style House
  • Fenced Yard
  • Garage

About This Home

As of November 2014

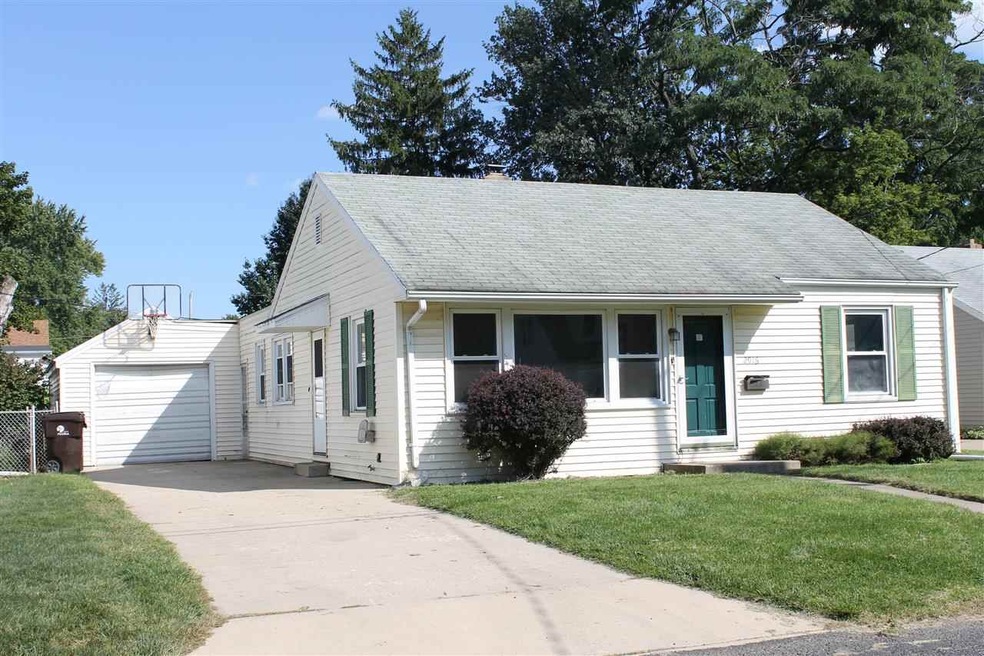
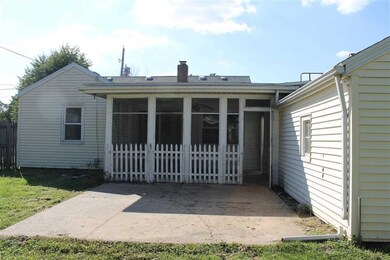
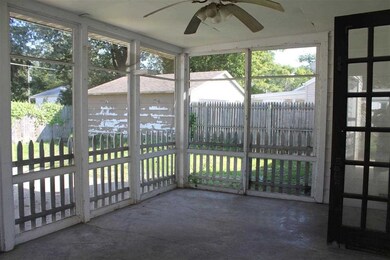
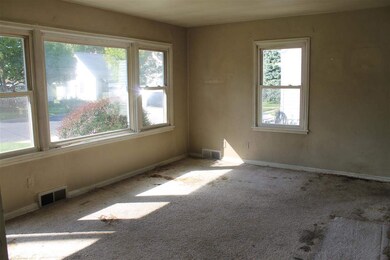
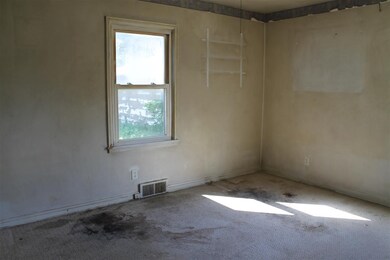
3 bedroom home in St. Philomena Subdivision. 3 season screened porch with private fenced rear yard.

Last Agent to Sell the Property

Brandy Delaney

Jim Maloof Realty, Inc. License #475132088 Listed on: 09/25/2014

Last Buyer's Agent

Melissa Stevenson

Keller Williams Revolution License #475120113

Keller Williams Revolution

Home Details

Home Type

  • Single Family

Est. Annual Taxes

  • $2,065

Year Built

  • Built in 1948

Lot Details

  • 5,097

Parking

  • Garage

Home Design

  • Ranch Style House

Schools

  • Thomas Jefferson Elementary School

Additional Features

  • 1 Full Bathroom
  • Fenced Yard
  • Cable TV Available

Home Details

Home Type

Single Family

Est. Annual Taxes

$2,065

Year Built

Built in 1948

Lot Details

0

Listing Details

  • Class: Residential
  • Type: Single Family
  • Style: Ranch
  • Legal Description: St. Philomena Ct NE 1/4 Sec 32-9-8E Lot 19
  • Year Built: 1948
  • Special Features: None
  • Property Sub Type: Detached

Interior Features

  • Interior Amenities: Cable Tv Available
  • Total Bathrooms: 1
  • Total Full Baths: 1
  • Number of Main Level Full Bathrooms: 1
  • Bedrooms: 3
  • Master Bedroom: Dimensions: 11x11, On Level: Main, Flooring: Carpet
  • Basement Foundation: Full
  • Bathroom Master Bedroom: None
  • Bedroom 2: Dimensions: 10x10, On Level: Main, Flooring: Hardwood
  • Bedroom 3: Dimensions: 10x9, On Level: Main, Flooring: Hardwood
  • Informal Dining Room: Dimensions: 8x9, On Level: Main, Flooring: Vinyl
  • Kitchen: Dimensions: 10x10, On Level: Main, Flooring: Vinyl
  • Kitchen Dining: Dining Informal
  • Laundry: On Level: Basement
  • Living Room: Dimensions: 16x11, On Level: Main, Flooring: Carpet
  • Total Basement Sq Ft: 1004
  • Price Per Sq Ft: 55.78
  • Finished Sq Ft: 1004
  • Total Sq Ft: 1004
  • Finished Main Level Sq Ft: 1004

Exterior Features

  • Exterior: Vinyl Siding
  • Exterior Amenities: Fenced Yard, Porch/Screened
  • Road Access: Paved
  • Roofing: Shingles

Garage/Parking

  • Garage Parking: Attached
  • Garage Yn: Yes
  • Number Cars: 1

Utilities

  • Heating Cooling: Gas, Forced Air, Central Air
  • Utilities On: Yes
  • Water Sewer: Public Water, Public Sewer

Schools

  • Elementary School: Thomas Jefferson
  • Middle School: Columbia
  • High School: Peoria High
  • Elementary School: Thomas Jefferson

Lot Info

  • Estimated Lot Size: 50 x 103
  • Lot Description: Level
  • Subdivision: St Philomena
  • Geo Subdivision: IL

Tax Info

  • Annual Taxes: 2064.68
  • Parcel Id Number Tax Id: 1432227013
  • Tax Year: 2013

MLS Schools

  • High School School District: Peoria High
  • Middle School: Columbia

Ownership History

Date Name Owned For Owner Type

Purchase Details

Closed on
Feb 22, 2019
Sold by
Lsf9 Master Participation
Bought by
Stevenson Prop Of Peoria Llc
Current Estimated Value
$104,180

Purchase Details

Closed on
Feb 21, 2019
Sold by
Lsf9 Master Participation
Bought by
Stevenson Prop Of Peoria Llc

Purchase Details

Closed on
Jan 23, 2002
Bought by
Twedell Amy K
Source: Public Records

Range of Values:

Collateral Analytics

Collateral Analytics Collateral Analytics AVMs (Automated Valuation Model) employ a number of statistical approaches combined with neighborhood-specific comparable selection guarantees the most up-to-date and precise valuations.

Not Available

Collateral Analytics does not have data for the current month. Please view the chart for historical values.

ICE

ICE Mortgage Technology ICE Mortgage Technology’s AVM (Automated Valuation Model) is a state-of-the-art online residential property valuation tool that provides a quick and accurate estimate of the value of almost any home in the U.S.

Not Available

ICE Mortgage Technology does not have data for the current month. Please view the chart for historical values.

First American

First American First American Data & Analytics’ next-generation AVM combines unrivaled data assets with a blended ensemble of valuation models to produce highly accurate, reliable valuations you can trust.

Not Available

First American does not have data for the current month. Please view the chart for historical values.

Quantarium

Quantarium Quantarium’s valuation service, repeatedly proven the industry’s most accurate and comprehensive, is supercharged with a self-learning and auto-tuning AI engine that continually becomes smarter and more accurate as it processes daily inputs from the industry’s leading RE data lake.

Not Available

Quantarium does not have data for the current month. Please view the chart for historical values.

Average Value
Not Available
List Price
Sold Price
Create a Home Valuation Report for This Property
The Home Valuation Report is an in-depth analysis detailing your home's value as well as a comparison with similar homes in the area

Home Values in the Area

Source: Public Records

Average Home Value in this Area


Source: Public Records

Purchase History

Date Buyer Sale Price Title Company
Stevenson Prop Of Peoria Llc -- Chicago Title Co
Twedell Amy K $79,000 --
Source: Public Records

Property History

Date Event Price Change Sq Ft Price
11/26/2014 11/26/14 Sold $56,000 -6.5% $56 / Sq Ft
11/13/2014 11/13/14 Pending -- -- --
09/25/2014 09/25/14 For Sale $59,900 -- $60 / Sq Ft
Source: RMLS Alliance

Tax History Compared to Growth

Source: Public Records

Tax History

Year Tax Paid Tax Assessment Tax Assessment Total Assessment is a certain percentage of the fair market value that is determined by local assessors to be the total taxable value of land and additions on the property. Land Improvement
2024 $3,215 $35,540 $6,670 $28,870
2023 $3,068 $32,610 $6,120 $26,490
2022 $2,997 $31,070 $6,080 $24,990
2021 $2,942 $29,590 $5,790 $23,800
2020 $2,935 $29,290 $5,730 $23,560
2019 $2,978 $29,890 $5,850 $24,040
2018 $2,803 $28,780 $5,910 $22,870
2017 $2,802 $29,070 $5,970 $23,100
2016 $2,724 $29,070 $5,970 $23,100
2015 $2,057 $28,500 $5,850 $22,650
2014 $2,065 $28,350 $5,550 $22,800
2013 -- $28,700 $5,620 $23,080
Source: Public Records

Agents Affiliated with this Home

  • Section Image
  • Section Image
See All Agents

Map

Source: RMLS Alliance

MLS Number: RMAPA1156666

RMLS Alliance

APN: 14-32-227-013