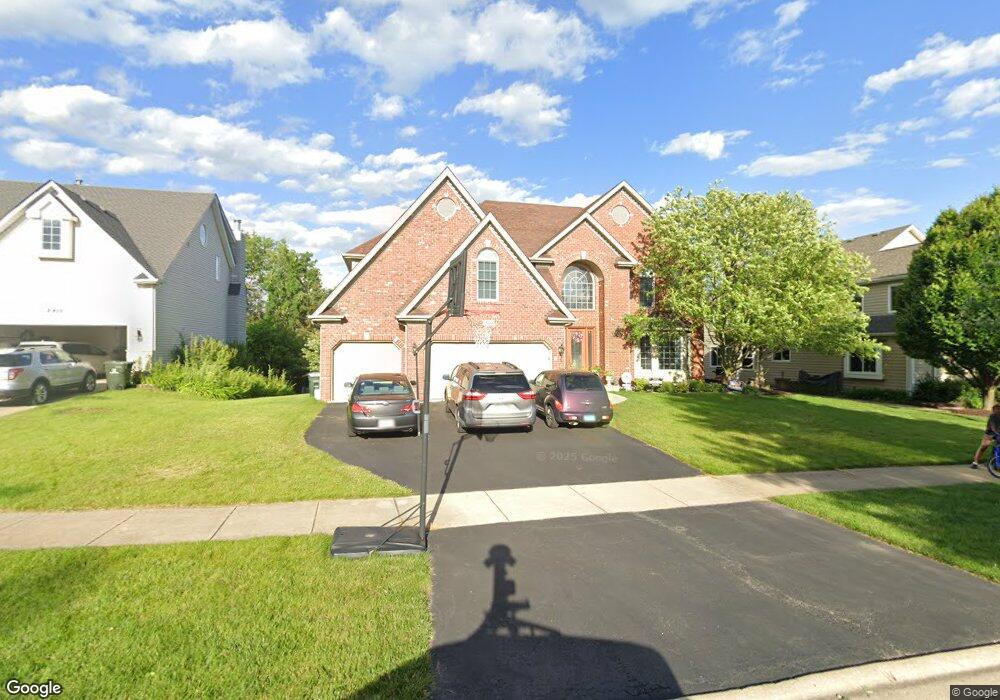
2916 Sibling Ct Naperville, IL 60564
Wood Lake NeighborhoodEstimated Value: $739,000 - $906,000
Studio
1
Bath
3,109
Sq Ft
$262/Sq Ft
Est. Value
About This Home
This home is located at 2916 Sibling Ct, Naperville, IL 60564 and is currently estimated at $814,045, approximately $261 per square foot. 2916 Sibling Ct is a home located in Will County with nearby schools including Welch Elementary School, Scullen Middle School, and Neuqua Valley High School.
Ownership History
Date
Name
Owned For
Owner Type
Purchase Details
Closed on
May 31, 2000
Sold by
Orr James C and Orr Kathleen A
Bought by
Nauman Michael B
Current Estimated Value
Home Financials for this Owner
Home Financials are based on the most recent Mortgage that was taken out on this home.
Original Mortgage
$315,200
Outstanding Balance
$109,377
Interest Rate
8%
Estimated Equity
$704,668
Purchase Details
Closed on
Feb 16, 2000
Sold by
Nauman Michael B
Bought by
Nauman Michael B and Nauman Teresa L
Purchase Details
Closed on
Mar 23, 1998
Sold by
Kobler Builders Inc
Bought by
Orr James C and Orr Kathleen A
Home Financials for this Owner
Home Financials are based on the most recent Mortgage that was taken out on this home.
Original Mortgage
$277,520
Interest Rate
7.09%
Create a Home Valuation Report for This Property
The Home Valuation Report is an in-depth analysis detailing your home's value as well as a comparison with similar homes in the area
Home Values in the Area
Average Home Value in this Area
Purchase History
| Date | Buyer | Sale Price | Title Company |
|---|---|---|---|
| Nauman Michael B | $394,000 | Greater Illinois Title Compa | |
| Nauman Michael B | -- | Chicago Title Insurance Co | |
| Orr James C | $347,000 | Chicago Title Insurance Co |
Source: Public Records
Mortgage History
| Date | Status | Borrower | Loan Amount |
|---|---|---|---|
| Open | Nauman Michael B | $315,200 | |
| Previous Owner | Orr James C | $277,520 |
Source: Public Records
Tax History
| Year | Tax Paid | Tax Assessment Tax Assessment Total Assessment is a certain percentage of the fair market value that is determined by local assessors to be the total taxable value of land and additions on the property. | Land | Improvement |
|---|---|---|---|---|
| 2024 | $13,867 | $219,711 | $54,021 | $165,690 |
| 2023 | $13,867 | $194,091 | $47,722 | $146,369 |
| 2022 | $12,868 | $183,607 | $45,145 | $138,462 |
| 2021 | $12,300 | $174,864 | $42,995 | $131,869 |
| 2020 | $12,157 | $172,094 | $42,314 | $129,780 |
| 2019 | $11,861 | $167,243 | $41,121 | $126,122 |
| 2018 | $11,549 | $160,175 | $40,216 | $119,959 |
| 2017 | $12,517 | $171,135 | $39,177 | $131,958 |
| 2016 | $12,495 | $167,451 | $38,334 | $129,117 |
| 2015 | $12,504 | $161,011 | $36,860 | $124,151 |
| 2014 | $12,504 | $155,513 | $36,860 | $118,653 |
| 2013 | $12,504 | $155,513 | $36,860 | $118,653 |
Source: Public Records
Map
Nearby Homes
- 2828 Bluewater Cir
- 2423 Durango Ln
- 1860 Tamahawk Ln
- 2939 Brossman St
- 3027 Brossman St
- 3111 Landore Dr
- 2552 Dewes Ln
- 2311 Leverenz Rd
- 2503 Skylane Dr
- 28W587 Leverenz Rd
- 29W376 Wagner Rd
- 28W555 Leverenz Rd
- 1364 Saxon Ln
- 3212 Bennett Dr
- 1367 Saxon Ln
- 2809 Alameda Ct
- 2725 Springdale Cir
- 2344 Corn Lily Rd
- 3412 Falkner Dr
- 1244 Hollingswood Ave
Your Personal Tour Guide
Ask me questions while you tour the home.