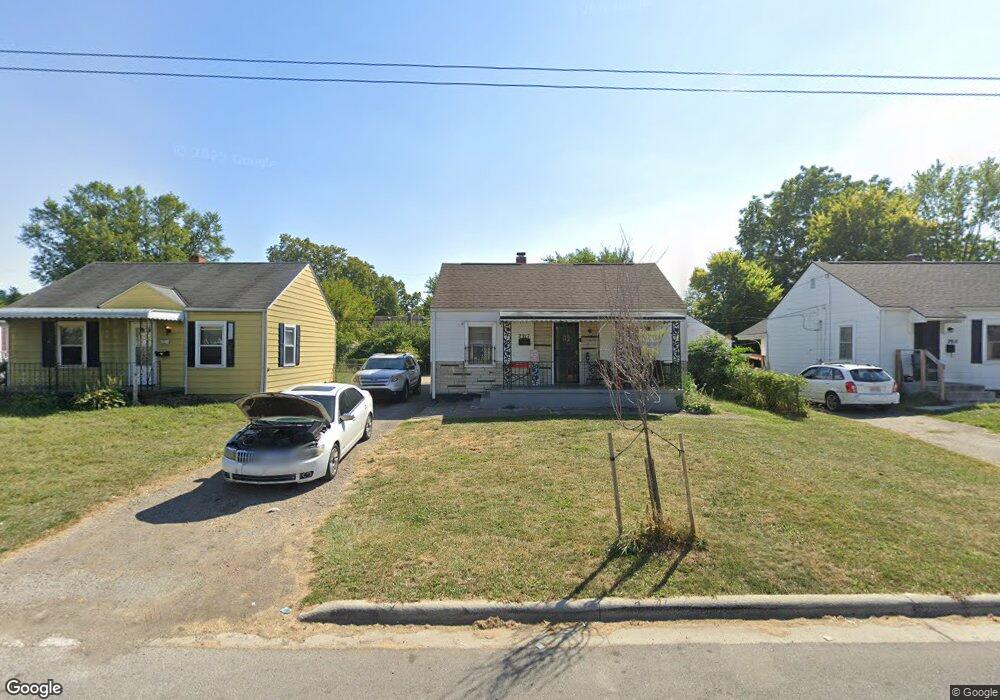
2917 E 13th Ave Columbus, OH 43219
Estimated Value: $157,000 - $169,762
3
Beds
1
Bath
1,183
Sq Ft
$139/Sq Ft
Est. Value
About This Home
This home is located at 2917 E 13th Ave, Columbus, OH 43219 and is currently estimated at $164,691, approximately $139 per square foot. 2917 E 13th Ave is a home located in Franklin County with nearby schools including East Columbus Elementary School, Champion Middle School, and East High School.
Ownership History
Date
Name
Owned For
Owner Type
Purchase Details
Closed on
Sep 20, 2013
Sold by
Smoot Kevin F and Woods Cove Llc
Bought by
D D Family Investments Llc
Current Estimated Value
Purchase Details
Closed on
May 4, 2005
Sold by
Mcclellan Matt Q and Mcclellan Kristin N
Bought by
Smoot Kevin F
Home Financials for this Owner
Home Financials are based on the most recent Mortgage that was taken out on this home.
Original Mortgage
$63,750
Interest Rate
8.7%
Mortgage Type
Purchase Money Mortgage
Purchase Details
Closed on
Jul 3, 2003
Sold by
Mcclellan Kristin N and Mcclellan Matt Q
Bought by
Mcclellan Matt Q and Mcclellan Kristin N
Purchase Details
Closed on
Oct 1, 1996
Sold by
Twins Ptns
Bought by
Kristin N Mcclellan
Purchase Details
Closed on
Nov 18, 1992
Purchase Details
Closed on
Jun 10, 1992
Create a Home Valuation Report for This Property
The Home Valuation Report is an in-depth analysis detailing your home's value as well as a comparison with similar homes in the area
Home Values in the Area
Average Home Value in this Area
Purchase History
| Date | Buyer | Sale Price | Title Company |
|---|---|---|---|
| D D Family Investments Llc | $15,236 | None Available | |
| Smoot Kevin F | $75,000 | World Class | |
| Mcclellan Matt Q | -- | -- | |
| Kristin N Mcclellan | $137,000 | -- | |
| -- | -- | -- | |
| -- | $25,000 | -- |
Source: Public Records
Mortgage History
| Date | Status | Borrower | Loan Amount |
|---|---|---|---|
| Previous Owner | Smoot Kevin F | $63,750 |
Source: Public Records
Tax History
| Year | Tax Paid | Tax Assessment Tax Assessment Total Assessment is a certain percentage of the fair market value that is determined by local assessors to be the total taxable value of land and additions on the property. | Land | Improvement |
|---|---|---|---|---|
| 2025 | $2,358 | $51,450 | $9,940 | $41,510 |
| 2024 | $2,358 | $51,450 | $9,940 | $41,510 |
| 2023 | $2,328 | $51,450 | $9,940 | $41,510 |
| 2022 | $1,114 | $20,970 | $1,790 | $19,180 |
| 2021 | $1,116 | $20,970 | $1,790 | $19,180 |
| 2020 | $1,118 | $20,970 | $1,790 | $19,180 |
| 2019 | $1,185 | $19,050 | $1,650 | $17,400 |
| 2018 | $1,110 | $19,050 | $1,650 | $17,400 |
| 2017 | $1,184 | $19,050 | $1,650 | $17,400 |
| 2016 | $1,139 | $16,770 | $2,380 | $14,390 |
| 2015 | $1,037 | $16,770 | $2,380 | $14,390 |
| 2014 | $1,040 | $16,770 | $2,380 | $14,390 |
| 2013 | $1,207 | $19,740 | $2,800 | $16,940 |
Source: Public Records
Map
Nearby Homes
- 2933 E 12th Ave
- 3001 E 12th Ave
- 2969 E 11th Ave
- 2864 E 10th Ave
- 2841 E 10th Ave
- 3123 E 13th Ave
- 2974 E 7th Ave
- 3014 E 7th Ave
- 0 E 7th Ave Unit Lot 79 225013171
- 0 E 7th Ave Unit Lot 77 225013170
- 0 E 7th Ave Unit Lot 78 225013168
- 00 E 7th Ave
- 2827 E 6th Ave
- 3237 E 12th Ave
- 2798 E 5th Ave
- 0 E 5th Ave Unit 226008473
- 1984 E 5th Ave
- 2570 E 5th Ave
- 755 Stelzer Rd Unit 54
- 755 Stelzer Rd Unit 135
- 2923 E 13th Ave
- 2911 E 13th Ave
- 2903 E 13th Ave
- 2929 E 13th Ave
- 2912 E 12th Ave
- 2918 E 12th Ave
- 2904 E 12th Ave
- 2935 E 13th Ave
- 2897 E 13th Ave
- 2900 E 12th Ave
- 2924 E 12th Ave
- 2918 E 13th Ave
- 2924 E 13th Ave
- 2930 E 13th Ave
- 2941 E 13th Ave
- 2904 E 13th Ave
- 2891 E 13th Ave
- 2892 E 12th Ave
- 2930 E 12th Ave
- 2898 E 13th Ave
Your Personal Tour Guide
Ask me questions while you tour the home.