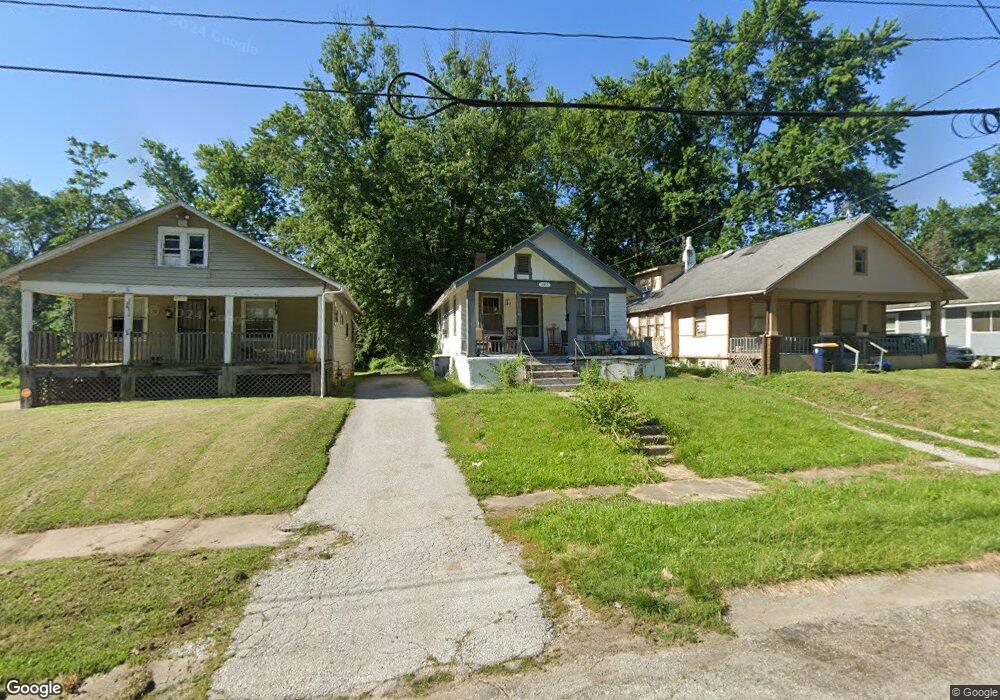
2917 E 73rd St Kansas City, MO 64132
Noble And Gregory Ridge NeighborhoodEstimated Value: $85,600 - $98,000
2
Beds
1
Bath
880
Sq Ft
$107/Sq Ft
Est. Value
About This Home
This home is located at 2917 E 73rd St, Kansas City, MO 64132 and is currently estimated at $93,867, approximately $106 per square foot. 2917 E 73rd St is a home located in Jackson County with nearby schools including Benjamin Banneker Elementary School, Central Middle School, and Southeast High School.
Ownership History
Date
Name
Owned For
Owner Type
Purchase Details
Closed on
Mar 18, 2025
Sold by
Depriest Harris Investment Company Llc
Bought by
Phelps Kieisha
Current Estimated Value
Purchase Details
Closed on
Apr 1, 2023
Sold by
Barewin Properties Llc
Bought by
Depriest Harris Investment Company Llc
Purchase Details
Closed on
Jun 6, 2022
Sold by
Barewin Properties Llc
Bought by
M & K Funding Llc
Purchase Details
Closed on
Jan 16, 2022
Sold by
Barewin Properties Llc
Bought by
Steinaman Acquistions Inc
Purchase Details
Closed on
Oct 6, 2021
Sold by
5611 Park St Series Kcm Investors Llc and Hodgin & Co Llc
Bought by
Ethereal Life Llc
Create a Home Valuation Report for This Property
The Home Valuation Report is an in-depth analysis detailing your home's value as well as a comparison with similar homes in the area
Home Values in the Area
Average Home Value in this Area
Purchase History
| Date | Buyer | Sale Price | Title Company |
|---|---|---|---|
| Phelps Kieisha | $47,858 | None Listed On Document | |
| Depriest Harris Investment Company Llc | -- | -- | |
| M & K Funding Llc | -- | None Listed On Document | |
| Steinaman Acquistions Inc | -- | None Listed On Document | |
| Steinaman Acquistions Inc | -- | None Listed On Document | |
| Steinaman Acquistions Inc | -- | None Listed On Document | |
| Ethereal Life Llc | -- | Platinum Title |
Source: Public Records
Mortgage History
| Date | Status | Borrower | Loan Amount |
|---|---|---|---|
| Closed | Steinaman Acquistions Inc | $0 |
Source: Public Records
Tax History Compared to Growth
Tax History
| Year | Tax Paid | Tax Assessment Tax Assessment Total Assessment is a certain percentage of the fair market value that is determined by local assessors to be the total taxable value of land and additions on the property. | Land | Improvement |
|---|---|---|---|---|
| 2025 | $375 | $3,267 | $2,573 | $694 |
| 2024 | $375 | $4,750 | $1,178 | $3,572 |
| 2023 | $541 | $6,922 | $589 | $6,333 |
| 2022 | $203 | $2,470 | $1,055 | $1,415 |
| 2021 | $202 | $2,470 | $1,055 | $1,415 |
| 2020 | $212 | $2,556 | $1,055 | $1,501 |
| 2019 | $208 | $2,556 | $1,055 | $1,501 |
| 2018 | $163 | $2,046 | $561 | $1,485 |
| 2017 | $163 | $2,046 | $561 | $1,485 |
| 2016 | $160 | $1,995 | $561 | $1,434 |
| 2014 | $160 | $1,995 | $561 | $1,434 |
Source: Public Records
Map
Nearby Homes
- 3913 E 73rd St
- 7325 Walrond Ave
- 2650 NE 74th Terrace
- 7119 Bellefontaine Ave
- 7115 Bellefontaine Ave
- 7103 Agnes Ave
- 7216 Indiana Ave
- 7040 Agnes Ave
- 7426 Indiana Ave
- 7012 S Benton Ave
- 7233 Park Ave
- 6947 Bellefontaine Ave
- 7015 College Ave
- 2216 E 73rd St
- 3500 E 75th St
- 2422 E 70th Terrace
- 2304 E 75th St
- 6933 Walrond Ave
- 6942 College Ave
- 7300 Brooklyn Ave
- 2919 E 73rd St
- 2907 E 73rd St
- 2905 E 73rd St
- 2925 E 73rd St
- 2910 E 73rd St
- 7301 S Benton Ave
- 2902 E 73rd St
- 7312 Agnes Ave
- 7244 Agnes Ave
- 7311 S Benton Ave
- 7315 S Benton Ave
- 7237 S Benton Ave
- 7314 Agnes Ave
- 2920 E 73rd St
- 7240 Agnes Ave
- 7300 S Benton Ave
- 3001 E 73rd St
- 7317 S Benton Ave
- 7316 Agnes Ave
- 7310 S Benton Ave