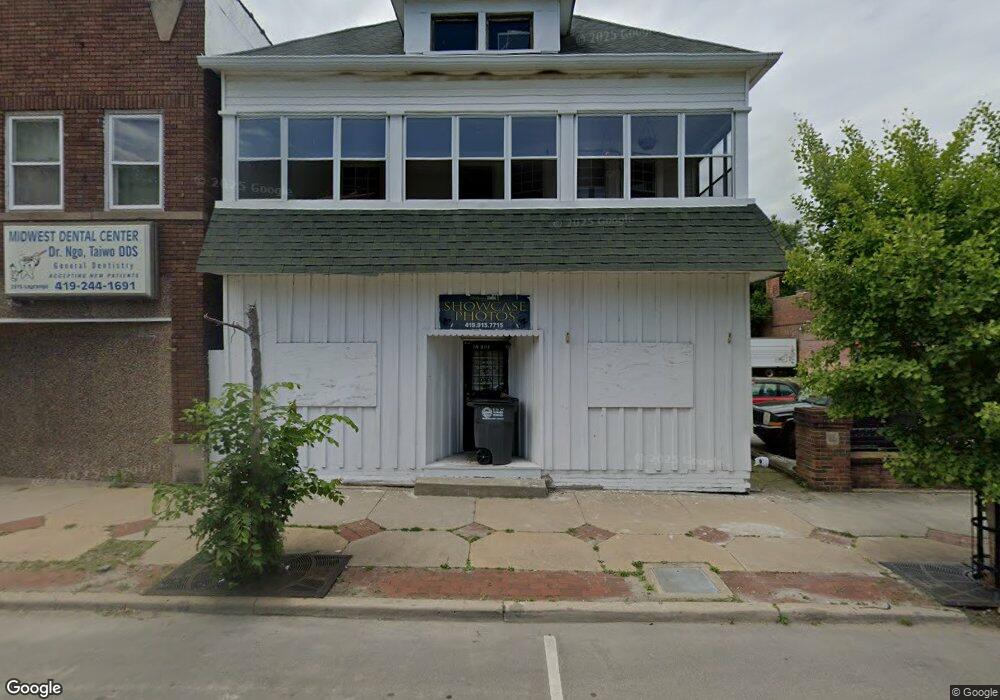
2917 Lagrange St Toledo, OH 43608
Lagrange NeighborhoodEstimated Value: $114,938
Studio
1
Bath
6,612
Sq Ft
$17/Sq Ft
Est. Value
About This Home
This home is located at 2917 Lagrange St, Toledo, OH 43608 and is currently estimated at $114,938, approximately $17 per square foot. 2917 Lagrange St is a home located in Lucas County with nearby schools including Spring Elementary School, Woodward High School, and Central Catholic High School.
Ownership History
Date
Name
Owned For
Owner Type
Purchase Details
Closed on
Jun 24, 2005
Sold by
Kasza Denise L and Kasza Mark D
Bought by
Gray Benjamin L
Current Estimated Value
Purchase Details
Closed on
Jan 19, 1999
Sold by
Cordrey and Nership An Oh Part Nership
Bought by
Kasza Denise L and Kasza Appraisal Service
Home Financials for this Owner
Home Financials are based on the most recent Mortgage that was taken out on this home.
Original Mortgage
$57,500
Interest Rate
6.81%
Mortgage Type
Commercial
Purchase Details
Closed on
Mar 10, 1997
Sold by
Piotrowski Bernard
Bought by
Cordrey & Kasza Inc
Home Financials for this Owner
Home Financials are based on the most recent Mortgage that was taken out on this home.
Original Mortgage
$31,600
Interest Rate
7.93%
Mortgage Type
Commercial
Purchase Details
Closed on
Nov 15, 1991
Sold by
Piotrowski Stella A
Purchase Details
Closed on
Nov 22, 1988
Sold by
Piotrowski P A and S A
Create a Home Valuation Report for This Property
The Home Valuation Report is an in-depth analysis detailing your home's value as well as a comparison with similar homes in the area
Home Values in the Area
Average Home Value in this Area
Purchase History
| Date | Buyer | Sale Price | Title Company |
|---|---|---|---|
| Gray Benjamin L | $69,000 | Metro Title Agency Inc | |
| Kasza Denise L | $22,000 | Louisville Title Agency For | |
| Cordrey & Kasza Inc | $36,000 | -- | |
| -- | -- | -- | |
| -- | -- | -- |
Source: Public Records
Mortgage History
| Date | Status | Borrower | Loan Amount |
|---|---|---|---|
| Previous Owner | Kasza Denise L | $57,500 | |
| Previous Owner | Cordrey & Kasza Inc | $31,600 |
Source: Public Records
Map
Nearby Homes
- 168 Dexter St
- 235 Bronson Ave
- 161 Mettler St
- 322 Dexter St
- 313 Mettler St
- 231 E Central Ave
- 332 Kosciusko St
- 3008 Warsaw St
- 2743 Elm St
- 324 Moss St
- 427 Everett St
- 2619 Locust St
- 346 E Streicher St
- 319 E Streicher St
- 2919 Chestnut St
- 333 Palmer St
- 5 Birckhead Place
- 3201 Warsaw St
- 2824 Chestnut St
- 346 E Weber St
- 2927 Lagrange St
- 177 Dexter St
- 173 Dexter St
- 172 Bronson Ave
- 171 Dexter St
- 2930 Lagrange St
- 168 Bronson Ave
- 167 Dexter St
- 2932 Lagrange St
- 164 Bronson Ave
- 2859 Lagrange St
- 2936 Lagrange St
- 2861 Lagrange St
- 165 Dexter St
- 162 Bronson Ave
- 2857 Lagrange St
- 2938 Lagrange St
- 161 Dexter St
- 160 Bronson Ave
- 219 Bronson Ave
Your Personal Tour Guide
Ask me questions while you tour the home.