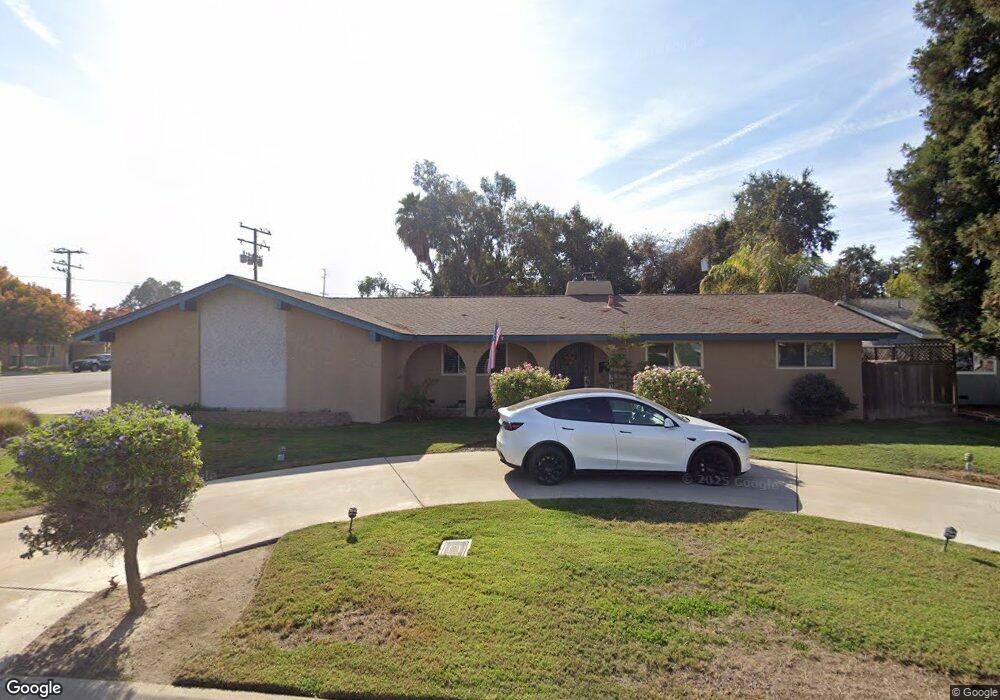
2917 W Vassar Ave Visalia, CA 93277
Mooney NeighborhoodEstimated Value: $373,750 - $395,000
3
Beds
2
Baths
1,610
Sq Ft
$240/Sq Ft
Est. Value
About This Home
This home is located at 2917 W Vassar Ave, Visalia, CA 93277 and is currently estimated at $386,938, approximately $240 per square foot. 2917 W Vassar Ave is a home located in Tulare County with nearby schools including Royal Oaks Elementary School, Green Acres Middle School, and Mt. Whitney High School.
Ownership History
Date
Name
Owned For
Owner Type
Purchase Details
Closed on
Feb 14, 2000
Sold by
Central Valley Christian Housing Develop
Bought by
Casey Randy A and Casey Marsha L
Current Estimated Value
Home Financials for this Owner
Home Financials are based on the most recent Mortgage that was taken out on this home.
Original Mortgage
$121,813
Outstanding Balance
$40,592
Interest Rate
8.27%
Mortgage Type
FHA
Estimated Equity
$346,346
Purchase Details
Closed on
Aug 23, 1999
Sold by
Hud
Bought by
Central Vly Christian Hsng Development
Home Financials for this Owner
Home Financials are based on the most recent Mortgage that was taken out on this home.
Original Mortgage
$87,000
Interest Rate
7.47%
Mortgage Type
Purchase Money Mortgage
Purchase Details
Closed on
Nov 2, 1998
Sold by
Burns Dana E
Bought by
Countrywide Home Loans Inc
Purchase Details
Closed on
Jul 30, 1998
Sold by
Countrywide Home Loans Inc
Bought by
Hud
Create a Home Valuation Report for This Property
The Home Valuation Report is an in-depth analysis detailing your home's value as well as a comparison with similar homes in the area
Home Values in the Area
Average Home Value in this Area
Purchase History
| Date | Buyer | Sale Price | Title Company |
|---|---|---|---|
| Casey Randy A | $122,000 | Cuesta Title Company | |
| Central Vly Christian Hsng Development | $80,000 | Cuesta Title Company | |
| Countrywide Home Loans Inc | $107,670 | First American Title Co | |
| Hud | -- | First American Title Co |
Source: Public Records
Mortgage History
| Date | Status | Borrower | Loan Amount |
|---|---|---|---|
| Open | Casey Randy A | $121,813 | |
| Previous Owner | Central Vly Christian Hsng Development | $87,000 |
Source: Public Records
Tax History Compared to Growth
Tax History
| Year | Tax Paid | Tax Assessment Tax Assessment Total Assessment is a certain percentage of the fair market value that is determined by local assessors to be the total taxable value of land and additions on the property. | Land | Improvement |
|---|---|---|---|---|
| 2025 | $1,906 | $187,515 | $53,797 | $133,718 |
| 2024 | $1,906 | $183,840 | $52,743 | $131,097 |
| 2023 | $1,852 | $180,236 | $51,709 | $128,527 |
| 2022 | $1,768 | $176,703 | $50,696 | $126,007 |
| 2021 | $1,769 | $173,238 | $49,702 | $123,536 |
| 2020 | $1,751 | $171,461 | $49,192 | $122,269 |
| 2019 | $1,702 | $168,099 | $48,227 | $119,872 |
| 2018 | $1,655 | $164,803 | $47,281 | $117,522 |
| 2017 | $1,639 | $161,572 | $46,354 | $115,218 |
| 2016 | $1,605 | $158,404 | $45,445 | $112,959 |
| 2015 | $1,556 | $156,024 | $44,762 | $111,262 |
| 2014 | $1,556 | $152,968 | $43,885 | $109,083 |
Source: Public Records
Map
Nearby Homes
- 1834 S Redwood St
- 2219 S Linda Vista St
- 2135 S Woodland St
- 2316 S Verde Vista St
- 3116 W Beech Ave
- 3125 W Howard Ave
- 2318 S Terrace St
- 2419 W Harvard Ave
- 2245 S Sallee St
- 1330 S Clover St
- 3504 W Cutler Ave
- 1937 S Royal Oaks Dr
- 2650 S Linda Vista St
- 1138 S Valley St
- 1419 S Crowe St
- 3124 W Tulare Ave
- 1127 S Whitney Dr
- 2724 S County Center Dr
- 3515 W Iris Ave
- 3708 W Paradise Ave
- 2931 W Vassar Ave
- 1919 S County Center Dr
- 2941 W Vassar Ave
- 2920 W Vassar Ave
- 2920 W Walnut Ave
- 2934 W Vassar Ave
- 3003 W Vassar Ave
- 1846 S County Center Dr
- 3000 W Walnut Ave
- 2944 W Vassar Ave
- 1832 S County Center Dr
- 3013 W Vassar Ave
- 3006 W Vassar Ave
- 1819 S County Center Dr
- 2845 W Dartmouth Ave
- 2943 W Cambridge Ave
- 2917 W Walnut Ave
- 2009 S County Center Dr
- 3016 W Vassar Ave
- 2929 W Walnut Ave