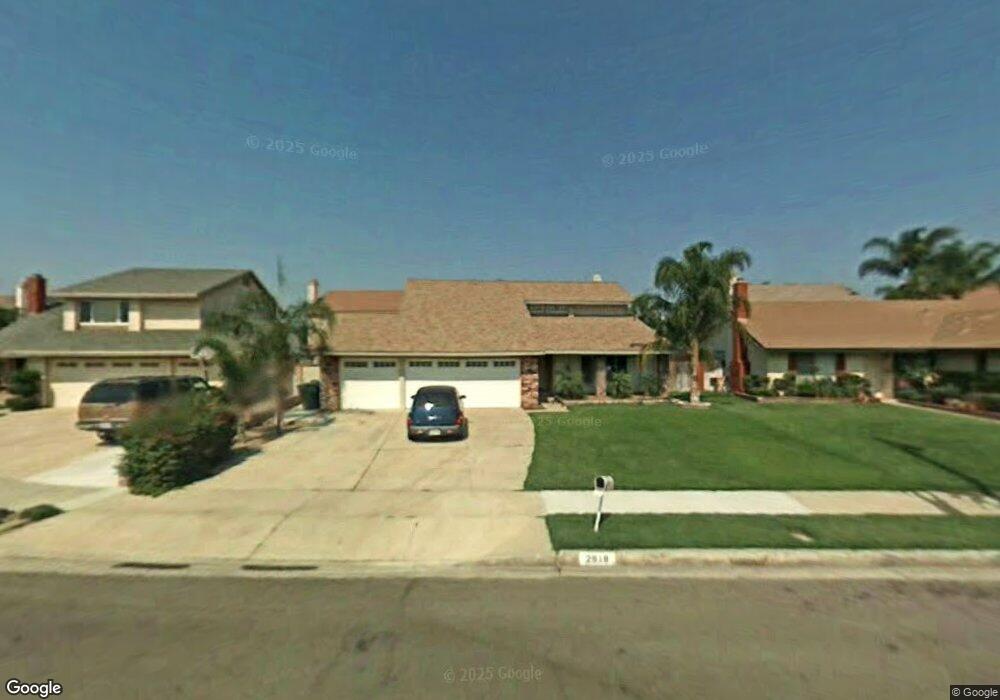
2918 Garfield Ave Ontario, CA 91761
Ontario Ranch NeighborhoodEstimated Value: $761,000 - $804,000
4
Beds
3
Baths
1,779
Sq Ft
$436/Sq Ft
Est. Value
About This Home
This home is located at 2918 Garfield Ave, Ontario, CA 91761 and is currently estimated at $775,244, approximately $435 per square foot. 2918 Garfield Ave is a home located in San Bernardino County with nearby schools including Liberty Elementary School, Woodcrest Junior High, and Chino High School.
Ownership History
Date
Name
Owned For
Owner Type
Purchase Details
Closed on
Nov 12, 2009
Sold by
Willow Vista Rentals Llc
Bought by
Lee Frank D
Current Estimated Value
Home Financials for this Owner
Home Financials are based on the most recent Mortgage that was taken out on this home.
Original Mortgage
$232,000
Outstanding Balance
$150,165
Interest Rate
4.83%
Mortgage Type
New Conventional
Estimated Equity
$625,079
Purchase Details
Closed on
Sep 10, 2009
Sold by
Hernandez David and Hernandez Eva
Bought by
Willow Vista Rentals Llc
Purchase Details
Closed on
Nov 20, 2008
Sold by
Hernandez David and Hernandez Eva
Bought by
Hernandez David
Purchase Details
Closed on
Nov 24, 2004
Sold by
Hernandez David
Bought by
Hernandez David and Hernandez Eva
Home Financials for this Owner
Home Financials are based on the most recent Mortgage that was taken out on this home.
Original Mortgage
$280,000
Interest Rate
5.65%
Mortgage Type
New Conventional
Purchase Details
Closed on
Sep 20, 2001
Sold by
Benioff David and Benioff Paula
Bought by
Hernandez David
Home Financials for this Owner
Home Financials are based on the most recent Mortgage that was taken out on this home.
Original Mortgage
$198,000
Interest Rate
6.87%
Purchase Details
Closed on
Sep 10, 1998
Sold by
Federal National Mortgage Association
Bought by
Benioff David and Benioff Paula
Home Financials for this Owner
Home Financials are based on the most recent Mortgage that was taken out on this home.
Original Mortgage
$151,943
Interest Rate
6.88%
Mortgage Type
FHA
Purchase Details
Closed on
Aug 6, 1998
Sold by
First Nationwide Mtg Corp
Bought by
Federal National Mortgage Association
Home Financials for this Owner
Home Financials are based on the most recent Mortgage that was taken out on this home.
Original Mortgage
$151,943
Interest Rate
6.88%
Mortgage Type
FHA
Purchase Details
Closed on
May 29, 1998
Sold by
Sims Micah G and Sims Zina A
Bought by
First Nationwide Mtg Corp
Purchase Details
Closed on
Jun 25, 1996
Sold by
Sims Micah G and Sims Zina A
Bought by
Sims Micah G
Home Financials for this Owner
Home Financials are based on the most recent Mortgage that was taken out on this home.
Original Mortgage
$25,000
Interest Rate
8.01%
Purchase Details
Closed on
Dec 9, 1994
Sold by
Carter Harris A and Carter Deniese M
Bought by
Sims Micah G and Sims Zina A
Home Financials for this Owner
Home Financials are based on the most recent Mortgage that was taken out on this home.
Original Mortgage
$142,500
Interest Rate
9.23%
Create a Home Valuation Report for This Property
The Home Valuation Report is an in-depth analysis detailing your home's value as well as a comparison with similar homes in the area
Home Values in the Area
Average Home Value in this Area
Purchase History
| Date | Buyer | Sale Price | Title Company |
|---|---|---|---|
| Lee Frank D | $300,000 | Fidelity National Title | |
| Willow Vista Rentals Llc | $223,000 | Fidelity National Title | |
| Hernandez David | -- | None Available | |
| Hernandez David | -- | Southland Title Of Burbank | |
| Hernandez David | $220,000 | Lawyers Title Company | |
| Benioff David | $155,000 | American Title | |
| Federal National Mortgage Association | -- | American Title Ins Co | |
| First Nationwide Mtg Corp | $145,000 | American Title Co | |
| Sims Micah G | -- | Gateway Title Company | |
| Sims Micah G | $150,000 | Orange Coast Title Co |
Source: Public Records
Mortgage History
| Date | Status | Borrower | Loan Amount |
|---|---|---|---|
| Open | Lee Frank D | $232,000 | |
| Previous Owner | Hernandez David | $280,000 | |
| Previous Owner | Hernandez David | $198,000 | |
| Previous Owner | Benioff David | $151,943 | |
| Previous Owner | Sims Micah G | $25,000 | |
| Previous Owner | Sims Micah G | $142,500 |
Source: Public Records
Tax History Compared to Growth
Tax History
| Year | Tax Paid | Tax Assessment Tax Assessment Total Assessment is a certain percentage of the fair market value that is determined by local assessors to be the total taxable value of land and additions on the property. | Land | Improvement |
|---|---|---|---|---|
| 2025 | $4,252 | $387,249 | $135,537 | $251,712 |
| 2024 | $4,252 | $379,655 | $132,879 | $246,776 |
| 2023 | $4,136 | $372,211 | $130,274 | $241,937 |
| 2022 | $4,111 | $364,913 | $127,720 | $237,193 |
| 2021 | $4,032 | $357,758 | $125,216 | $232,542 |
| 2020 | $3,981 | $354,090 | $123,932 | $230,158 |
| 2019 | $3,912 | $347,147 | $121,502 | $225,645 |
| 2018 | $3,827 | $340,341 | $119,120 | $221,221 |
| 2017 | $3,759 | $333,667 | $116,784 | $216,883 |
| 2016 | $3,516 | $327,124 | $114,494 | $212,630 |
| 2015 | $3,446 | $322,210 | $112,774 | $209,436 |
| 2014 | $3,379 | $315,898 | $110,565 | $205,333 |
Source: Public Records
Map
Nearby Homes
- 2919 S Caldwell Ave
- 1020 E Tam o Shanter Ct
- 2708 S Parkside Dr
- 2437 S Garfield Place
- 2453 S Marigold Place
- 2408 S Taylor Place
- 4235 S Gasly Paseo
- 0 Vineyard Unit CV25067044
- 4245 S Grasly Paseo
- 4233 S Grasly Paseo
- 0 Phillips Unit CV23180894
- 2817 S Lassen Ave
- 2535 S Imperial Place
- 513 E Fairfield Ct
- 2413 S Parco Ave
- 2424 S Lake Ave
- 2300 S Sultana Ave Unit 298
- 209 W Via Rua Flores
- 2119 S Phoenix Place
- 114 Cormorant Dr
- 2914 Garfield Ave
- 2922 Garfield Ave
- 2951 S Greenwood Ave
- 2959 S Greenwood Ave
- 2910 Garfield Ave
- 2945 S Greenwood Ave
- 1002 E Cottonwood Ct
- 2967 S Greenwood Ave
- 2913 Garfield Ave
- 2917 Garfield Ave
- 2906 Garfield Ave
- 2937 S Greenwood Ave
- 1008 E Cottonwood Ct
- 2909 Garfield Ave
- 2975 S Greenwood Ave
- 1014 E Cottonwood Ct
- 2902 Garfield Ave
- 2905 Garfield Ave
- 2929 S Greenwood Ave
- 2950 S Greenwood Ave