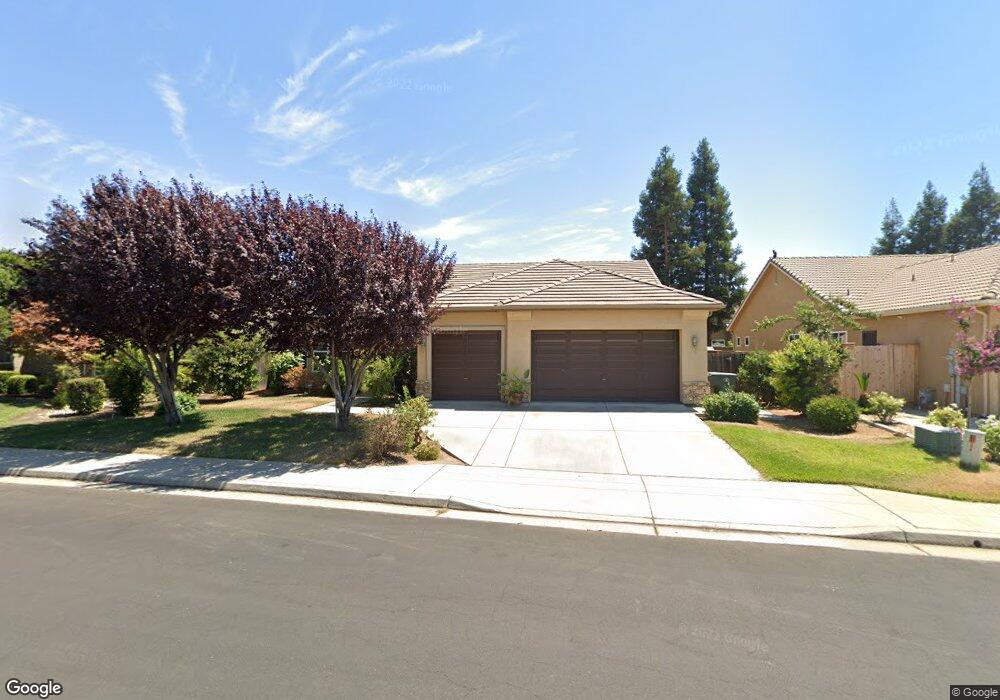
2918 Scott Ave Clovis, CA 93611
Estimated Value: $533,136 - $601,000
4
Beds
2
Baths
2,262
Sq Ft
$251/Sq Ft
Est. Value
About This Home
This home is located at 2918 Scott Ave, Clovis, CA 93611 and is currently estimated at $566,712, approximately $250 per square foot. 2918 Scott Ave is a home located in Fresno County with nearby schools including Red Bank Elementary School, Clark Intermediate School, and Clovis High School.
Ownership History
Date
Name
Owned For
Owner Type
Purchase Details
Closed on
Mar 28, 2010
Sold by
Fragoso Raymond E
Bought by
Huang Chung Ken and Baxter Serena Yang
Current Estimated Value
Purchase Details
Closed on
Jul 15, 2005
Sold by
Lesaca Oscar Q and Lesaca Diana M
Bought by
Fragoso Raymond E
Home Financials for this Owner
Home Financials are based on the most recent Mortgage that was taken out on this home.
Original Mortgage
$351,200
Interest Rate
4.87%
Mortgage Type
Purchase Money Mortgage
Purchase Details
Closed on
Apr 8, 2004
Sold by
Shaw/Locan #1 Inc
Bought by
Lesaca Oscar Q and Lesaca Diana M
Home Financials for this Owner
Home Financials are based on the most recent Mortgage that was taken out on this home.
Original Mortgage
$212,858
Interest Rate
5.35%
Mortgage Type
Purchase Money Mortgage
Create a Home Valuation Report for This Property
The Home Valuation Report is an in-depth analysis detailing your home's value as well as a comparison with similar homes in the area
Home Values in the Area
Average Home Value in this Area
Purchase History
| Date | Buyer | Sale Price | Title Company |
|---|---|---|---|
| Huang Chung Ken | $255,000 | Placer Title Company | |
| Fragoso Raymond E | $440,000 | First American Title Ins Co | |
| Lesaca Oscar Q | $284,000 | Fidelity National Title Co |
Source: Public Records
Mortgage History
| Date | Status | Borrower | Loan Amount |
|---|---|---|---|
| Previous Owner | Fragoso Raymond E | $351,200 | |
| Previous Owner | Lesaca Oscar Q | $212,858 |
Source: Public Records
Tax History
| Year | Tax Paid | Tax Assessment Tax Assessment Total Assessment is a certain percentage of the fair market value that is determined by local assessors to be the total taxable value of land and additions on the property. | Land | Improvement |
|---|---|---|---|---|
| 2025 | $3,972 | $329,149 | $82,607 | $246,542 |
| 2023 | $3,810 | $316,369 | $79,400 | $236,969 |
| 2022 | $3,759 | $310,167 | $77,844 | $232,323 |
| 2021 | $3,657 | $304,086 | $76,318 | $227,768 |
| 2020 | $3,642 | $300,969 | $75,536 | $225,433 |
| 2019 | $3,573 | $295,068 | $74,055 | $221,013 |
| 2018 | $3,497 | $289,283 | $72,603 | $216,680 |
| 2017 | $3,425 | $283,612 | $71,180 | $212,432 |
| 2016 | $3,312 | $278,052 | $69,785 | $208,267 |
| 2015 | $3,263 | $273,876 | $68,737 | $205,139 |
| 2014 | $3,203 | $268,512 | $67,391 | $201,121 |
Source: Public Records
Map
Nearby Homes
- 2782 Poe Ave
- 2668 Scott Ave
- 3045 Keats Ave
- 2222 Carson Ave
- 2020 Hanson Ave
- 2669 Alamos Ave
- 2143 Lombard Ln
- 2318 Lombard Ln
- 3154 Mitchell Ave
- 2449 Lombard Ln
- 2459 Lombard Ln
- 2631 Rall Ave
- 2518 Keats Ave
- 2549 Purvis Ave
- 2963 Finchwood Ave
- 3299 Poe Ave
- 2871 Wrenwood Ave
- 1178 Blackwood Ave
- 2681 Wrenwood Ave
- 2722 Park Ave
- 2928 Scott Ave
- 2908 Scott Ave
- 2915 Keats Ave
- 2905 Keats Ave
- 2938 Scott Ave
- 2923 Scott Ave
- 2913 Scott Ave
- 2933 Scott Ave
- 2935 Keats Ave
- 2903 Scott Ave
- 2948 Scott Ave
- 2858 Scott Ave
- 2865 Keats Ave
- 1676 Greenfield Ave
- 2945 Keats Ave
- 2906 Keats Ave
- 2916 Keats Ave
- 2930 San Jose Ave
- 1646 Greenfield Ave
- 2910 San Jose Ave
Your Personal Tour Guide
Ask me questions while you tour the home.