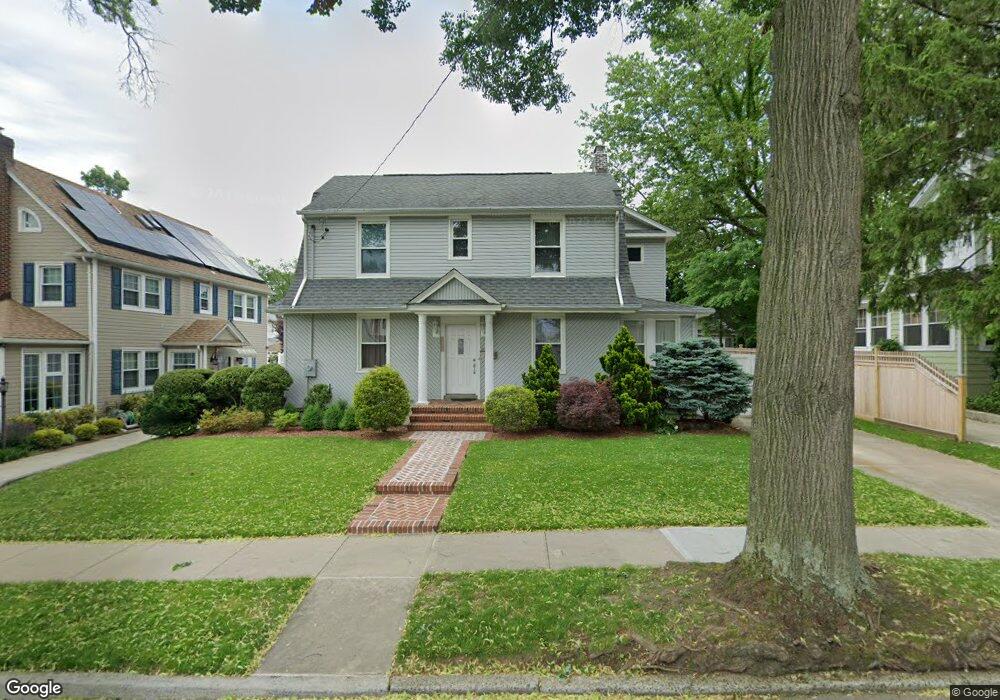
2919 161st St Flushing, NY 11358
Flushing NeighborhoodEstimated Value: $1,371,000 - $1,772,000
--
Bed
--
Bath
2,750
Sq Ft
$587/Sq Ft
Est. Value
About This Home
This home is located at 2919 161st St, Flushing, NY 11358 and is currently estimated at $1,613,937, approximately $586 per square foot. 2919 161st St is a home located in Queens County with nearby schools including P.S. 32 - State Street, I.S. 25 Adrien Block, and Francis Lewis High School.
Ownership History
Date
Name
Owned For
Owner Type
Purchase Details
Closed on
Feb 15, 2024
Sold by
Blas Vincent
Bought by
Kevin Blas Trustee and Michael Paul Blas Trustee
Current Estimated Value
Purchase Details
Closed on
May 1, 2009
Sold by
Blas As Joint Tenants Michael and With Right Of Survivorship
Bought by
Blas Vincent
Home Financials for this Owner
Home Financials are based on the most recent Mortgage that was taken out on this home.
Original Mortgage
$41,981
Interest Rate
4.92%
Mortgage Type
Purchase Money Mortgage
Purchase Details
Closed on
Dec 14, 2000
Sold by
Blas Vincent
Bought by
Blas Vincent and Blas Michael
Purchase Details
Closed on
Nov 4, 1999
Sold by
Estevez Domingo and Estevez Nelly Peralta
Bought by
Blas Vincent
Home Financials for this Owner
Home Financials are based on the most recent Mortgage that was taken out on this home.
Original Mortgage
$141,500
Interest Rate
7.61%
Mortgage Type
Purchase Money Mortgage
Create a Home Valuation Report for This Property
The Home Valuation Report is an in-depth analysis detailing your home's value as well as a comparison with similar homes in the area
Home Values in the Area
Average Home Value in this Area
Purchase History
| Date | Buyer | Sale Price | Title Company |
|---|---|---|---|
| Kevin Blas Trustee | -- | -- | |
| Kevin Blas Trustee | -- | -- | |
| Blas Vincent | -- | -- | |
| Blas Vincent | -- | -- | |
| Blas Vincent | -- | -- | |
| Blas Vincent | -- | -- | |
| Blas Vincent | $385,000 | -- | |
| Blas Vincent | $385,000 | -- |
Source: Public Records
Mortgage History
| Date | Status | Borrower | Loan Amount |
|---|---|---|---|
| Previous Owner | Blas Vincent | $41,981 | |
| Previous Owner | Blas Vincent | $141,500 |
Source: Public Records
Tax History Compared to Growth
Tax History
| Year | Tax Paid | Tax Assessment Tax Assessment Total Assessment is a certain percentage of the fair market value that is determined by local assessors to be the total taxable value of land and additions on the property. | Land | Improvement |
|---|---|---|---|---|
| 2025 | $12,106 | $76,382 | $20,712 | $55,670 |
| 2024 | $6,911 | $75,379 | $24,489 | $50,890 |
| 2023 | $11,451 | $71,543 | $20,270 | $51,273 |
| 2022 | $10,794 | $87,480 | $28,440 | $59,040 |
| 2021 | $10,731 | $93,540 | $28,440 | $65,100 |
| 2020 | $12,814 | $80,460 | $28,440 | $52,020 |
| 2019 | $12,482 | $79,860 | $28,440 | $51,420 |
| 2018 | $11,494 | $59,619 | $18,386 | $41,233 |
| 2017 | $10,820 | $56,245 | $21,979 | $34,266 |
| 2016 | $9,987 | $56,245 | $21,979 | $34,266 |
| 2015 | $6,180 | $53,043 | $28,878 | $24,165 |
| 2014 | $6,180 | $52,347 | $28,978 | $23,369 |
Source: Public Records
Map
Nearby Homes
- 2914 162nd St
- 16023 28th Ave
- 29-05 160th St
- 15911 29th Ave
- 27-22 Bayside Ln
- 16042 26th Ave
- 165 E 32nd St Unit 15C
- 165 E 32nd St Unit 9D
- 160-51 25th Dr
- 157-18 26th Ave
- 29-42 166th St
- 28-14 157th St
- 16608 29th Ave
- 163-50 25th Dr
- 24-44 163rd St
- 164-03 33rd Ave
- 32-12 161st St
- 25-46 Bayside Ln
- 32-18 157th St
- 2931 167th St
- 2915 161st St
- 2915 161st St
- 2925 161st St
- 2911 161st St
- 2926 162nd St
- 2920 162nd St
- 2929 161st St
- 2930 162nd St
- 2916 161st St
- 2916 161st St
- 2934 162nd St
- 29-34 162nd St Unit 2F
- 29-34 162nd St Unit 2NDFL
- 2903 161st St
- 29-16 161st St
- 2916 161st St
- 16108 29th Ave
- 2922 161st St
- 2935 161st St
- 2912 161st St