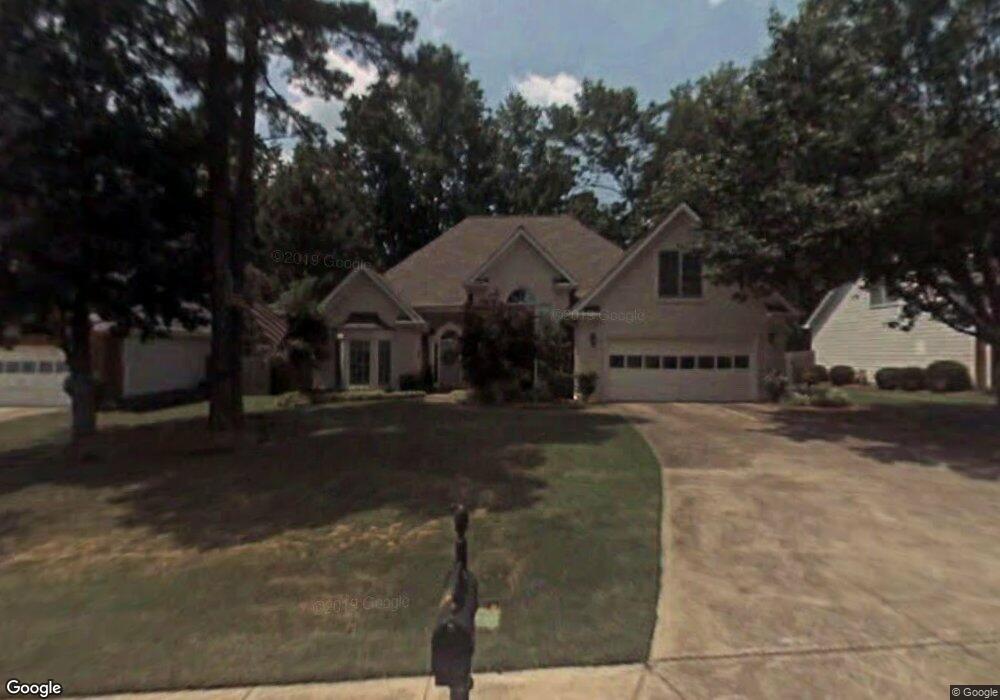
2919 Gavin Place Duluth, GA 30096
Estimated Value: $496,861 - $531,000
3
Beds
3
Baths
2,391
Sq Ft
$216/Sq Ft
Est. Value
About This Home
This home is located at 2919 Gavin Place, Duluth, GA 30096 and is currently estimated at $515,715, approximately $215 per square foot. 2919 Gavin Place is a home located in Gwinnett County with nearby schools including B.B. Harris Elementary School, Duluth Middle School, and Duluth High School.
Ownership History
Date
Name
Owned For
Owner Type
Purchase Details
Closed on
Nov 8, 2013
Sold by
Purdy John N
Bought by
Purdy John N and Purdy Mary Judith
Current Estimated Value
Home Financials for this Owner
Home Financials are based on the most recent Mortgage that was taken out on this home.
Original Mortgage
$205,000
Outstanding Balance
$152,126
Interest Rate
4.26%
Mortgage Type
VA
Estimated Equity
$363,589
Purchase Details
Closed on
May 23, 2005
Sold by
Palmer Paul R and Palmer Gloria
Bought by
Purdy John N and Purdy Judith
Home Financials for this Owner
Home Financials are based on the most recent Mortgage that was taken out on this home.
Original Mortgage
$43,700
Interest Rate
5.8%
Mortgage Type
Unknown
Purchase Details
Closed on
Jul 22, 1996
Sold by
Brentwood Homes Inc
Bought by
Palmer Paul R Gloria M
Create a Home Valuation Report for This Property
The Home Valuation Report is an in-depth analysis detailing your home's value as well as a comparison with similar homes in the area
Home Values in the Area
Average Home Value in this Area
Purchase History
| Date | Buyer | Sale Price | Title Company |
|---|---|---|---|
| Purdy John N | -- | -- | |
| Purdy John N | $243,000 | -- | |
| Palmer Paul R Gloria M | $189,900 | -- |
Source: Public Records
Mortgage History
| Date | Status | Borrower | Loan Amount |
|---|---|---|---|
| Open | Purdy John N | $205,000 | |
| Previous Owner | Purdy John N | $43,700 | |
| Previous Owner | Purdy John N | $175,000 | |
| Closed | Palmer Paul R Gloria M | $0 |
Source: Public Records
Tax History
| Year | Tax Paid | Tax Assessment Tax Assessment Total Assessment is a certain percentage of the fair market value that is determined by local assessors to be the total taxable value of land and additions on the property. | Land | Improvement |
|---|---|---|---|---|
| 2025 | $1,513 | $191,160 | $43,880 | $147,280 |
| 2024 | $1,511 | $193,880 | $42,000 | $151,880 |
| 2023 | $1,511 | $181,680 | $38,000 | $143,680 |
| 2022 | $1,468 | $162,600 | $34,000 | $128,600 |
| 2021 | $1,454 | $127,320 | $26,000 | $101,320 |
| 2020 | $1,452 | $124,560 | $26,000 | $98,560 |
| 2019 | $1,338 | $124,560 | $26,000 | $98,560 |
| 2018 | $1,320 | $103,080 | $22,800 | $80,280 |
| 2016 | $1,356 | $90,120 | $20,000 | $70,120 |
| 2015 | $3,301 | $90,120 | $20,000 | $70,120 |
| 2014 | $3,353 | $91,800 | $18,000 | $73,800 |
Source: Public Records
Map
Nearby Homes
- 2934 Seagull Dr
- 2859 Gavin Place
- 2820 Bluebird Cir NW
- 2820 Bluebird Cir
- 2667 Bluebird Cir
- 2741 Willowstone Dr
- 2775 Whippoorwill Cir
- 2893 Thurleston Ln
- 2770 Dogwood Creek Pkwy
- 2816 Staunton Dr
- 2816 Cardinal Lake Cir NW
- 3003 Brookhavenrun Cir
- 2895 Dogwood Creek Pkwy Unit 1
- 2932 Hunting Wood Walk
- 2240 Siskin Square Rd
- 2240 Siskin Square Rd Unit 88
- 2491 Cannon Farm Ln
- 2270 Siskin Square Rd Unit 91
- 2280 Siskin Square Rd Unit 92
- 3355 Cresswell Link Way
- 2909 Gavin Place
- 2929 Gavin Place
- 2866 Bob White Dr
- 2899 Gavin Place Unit 7
- 2939 Gavin Place NW
- 2924 Gavin Place
- 2904 Gavin Place
- 2876 Bob White Dr
- 2934 Gavin Place
- 2949 Gavin Place
- 2889 Gavin Place
- 2867 Bob White Dr
- 2894 Gavin Place
- 2944 Gavin Place
- 2924 Seagull Dr
- 2877 Bob White Dr
- 2478 Daventry Walk
- 2959 Gavin Place
- 2879 Gavin Place
- 2924 Seagull Dr NW
Your Personal Tour Guide
Ask me questions while you tour the home.