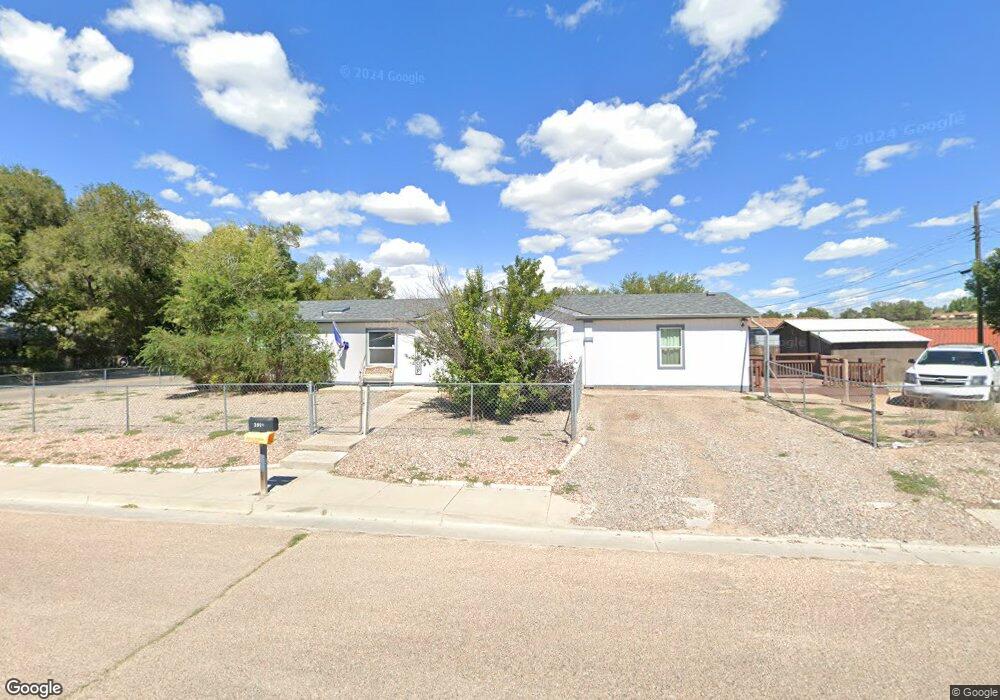
2919 W 26th St Pueblo, CO 81003
Park West NeighborhoodEstimated Value: $203,000 - $277,000
4
Beds
2
Baths
1,960
Sq Ft
$119/Sq Ft
Est. Value
About This Home
This home is located at 2919 W 26th St, Pueblo, CO 81003 and is currently estimated at $233,241, approximately $119 per square foot. 2919 W 26th St is a home located in Pueblo County with nearby schools including Morton Elementary School, Risley International Academy of Innovation, and Centennial High School.
Ownership History
Date
Name
Owned For
Owner Type
Purchase Details
Closed on
Dec 23, 2020
Sold by
Stevens Richard P and Stevens Kathrine A
Bought by
Martinez Anthony M and Martinez Jessica L
Current Estimated Value
Home Financials for this Owner
Home Financials are based on the most recent Mortgage that was taken out on this home.
Original Mortgage
$157,102
Outstanding Balance
$140,117
Interest Rate
2.8%
Mortgage Type
FHA
Estimated Equity
$93,124
Purchase Details
Closed on
Jan 21, 2007
Sold by
U S Bank Na
Bought by
Stevens Richard P and Stevens Katharine A
Purchase Details
Closed on
Sep 6, 2006
Sold by
Garcia Michael and Valdez Katherine
Bought by
U S Bank Na
Purchase Details
Closed on
Nov 20, 2001
Sold by
Garcia Michael
Bought by
Garcia M M and Garcia Valdez K
Purchase Details
Closed on
Dec 22, 2000
Sold by
Straightline Investments Llc
Bought by
Cedarcrest Homes Inc
Purchase Details
Closed on
Apr 27, 2000
Bought by
Straightline Investments Llc
Create a Home Valuation Report for This Property
The Home Valuation Report is an in-depth analysis detailing your home's value as well as a comparison with similar homes in the area
Home Values in the Area
Average Home Value in this Area
Purchase History
| Date | Buyer | Sale Price | Title Company |
|---|---|---|---|
| Martinez Anthony M | $160,000 | Land Title Guarantee Company | |
| Stevens Richard P | $40,000 | None Available | |
| U S Bank Na | -- | None Available | |
| Garcia M M | -- | -- | |
| Cedarcrest Homes Inc | -- | -- | |
| Straightline Investments Llc | $33,000 | -- |
Source: Public Records
Mortgage History
| Date | Status | Borrower | Loan Amount |
|---|---|---|---|
| Open | Martinez Anthony M | $157,102 |
Source: Public Records
Tax History Compared to Growth
Tax History
| Year | Tax Paid | Tax Assessment Tax Assessment Total Assessment is a certain percentage of the fair market value that is determined by local assessors to be the total taxable value of land and additions on the property. | Land | Improvement |
|---|---|---|---|---|
| 2024 | $1,430 | $14,580 | -- | -- |
| 2023 | $1,445 | $18,270 | $940 | $17,330 |
| 2022 | $1,066 | $10,740 | $450 | $10,290 |
| 2021 | $1,100 | $11,050 | $460 | $10,590 |
| 2020 | $757 | $11,050 | $460 | $10,590 |
| 2019 | $757 | $7,500 | $143 | $7,357 |
| 2018 | $478 | $5,275 | $144 | $5,131 |
| 2017 | $483 | $5,275 | $144 | $5,131 |
| 2016 | $531 | $5,848 | $159 | $5,689 |
| 2015 | $265 | $5,848 | $159 | $5,689 |
| 2014 | $274 | $6,045 | $159 | $5,886 |
Source: Public Records
Map
Nearby Homes
- 2508 Carthage Ave
- 2615 Lambert Ave
- 3005 W 28th St
- 2800 Wills Blvd
- 2315 Adrian Ave
- 2430 Denver Blvd
- TBD Adrian Ave
- 2255 Denver Blvd
- 2901 Denver Blvd
- 2204 W 22nd St
- 2803 Baltimore Ave
- 2915 Cheyenne Ave
- 2920 Cheyenne Ave
- 8202 San Isabel Ave
- TBD W 31st St
- 2337 Cruz Ct
- 2726 Arlington Ave
- 2108 W 19th St
- 2423 W 19th St
- 2200 Lewis Ave
- 0 26th St
- 2603 Carthage Ave
- 2620 Lowell Ave
- 2526 Lowell Ave
- 2601 Lowell Ave
- 2605 Lowell Ave
- 2521 Carthage Ave
- 2615 Lowell Ave
- 3002 W 26th St
- 2624 Lowell Ave
- 2520 Lowell Ave
- 2523 Lowell Ave
- 2523 Lowell Ave Unit 28+
- 2628 Lowell Ave
- 2519 Lowell Ave Unit 25+
- 2519 Lowell Ave
- 2519 Carthage Ave
- 2602 Lambert Ave
- 2616 Lambert Ave
- 2526 Lambert Ave