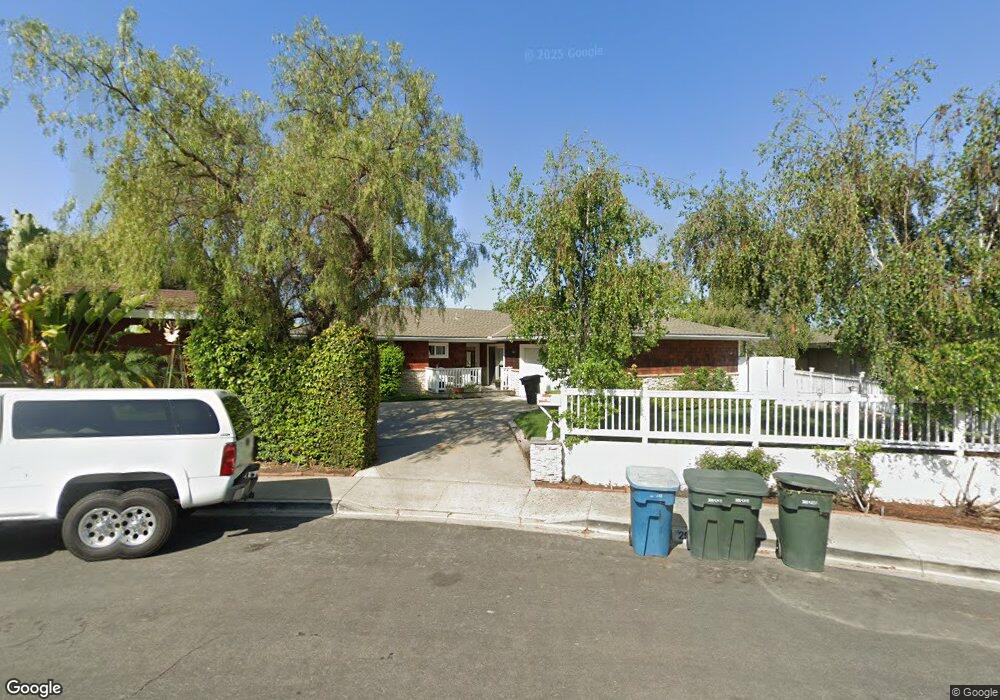
29191 Aloma Ave Laguna Niguel, CA 92677
Estimated Value: $1,396,763 - $1,468,000
3
Beds
2
Baths
1,759
Sq Ft
$815/Sq Ft
Est. Value
About This Home
This home is located at 29191 Aloma Ave, Laguna Niguel, CA 92677 and is currently estimated at $1,434,191, approximately $815 per square foot. 29191 Aloma Ave is a home located in Orange County with nearby schools including Hidden Hills Elementary, Niguel Hills Middle School, and Dana Hills High School.
Ownership History
Date
Name
Owned For
Owner Type
Purchase Details
Closed on
Jul 15, 2015
Sold by
Anderson Dusty L
Bought by
Dusty Lee Anderson Revocable Trust and Anderson
Current Estimated Value
Purchase Details
Closed on
Aug 12, 1996
Sold by
Robert Schulz and Robert Helen
Bought by
Anderson Dusty L and Anderson Kerrie L
Home Financials for this Owner
Home Financials are based on the most recent Mortgage that was taken out on this home.
Original Mortgage
$207,100
Interest Rate
7.75%
Purchase Details
Closed on
Jan 18, 1995
Sold by
Berry Karen E
Bought by
Schulz Robert D and Schulz Helen A
Home Financials for this Owner
Home Financials are based on the most recent Mortgage that was taken out on this home.
Original Mortgage
$152,000
Interest Rate
7.5%
Create a Home Valuation Report for This Property
The Home Valuation Report is an in-depth analysis detailing your home's value as well as a comparison with similar homes in the area
Home Values in the Area
Average Home Value in this Area
Purchase History
| Date | Buyer | Sale Price | Title Company |
|---|---|---|---|
| Dusty Lee Anderson Revocable Trust | -- | California Title Company | |
| Anderson Dusty L | $218,000 | Chicago Title Co | |
| Schulz Robert D | $190,000 | First American Title Ins Co |
Source: Public Records
Mortgage History
| Date | Status | Borrower | Loan Amount |
|---|---|---|---|
| Previous Owner | Anderson Dusty L | $207,100 | |
| Previous Owner | Schulz Robert D | $152,000 |
Source: Public Records
Tax History Compared to Growth
Tax History
| Year | Tax Paid | Tax Assessment Tax Assessment Total Assessment is a certain percentage of the fair market value that is determined by local assessors to be the total taxable value of land and additions on the property. | Land | Improvement |
|---|---|---|---|---|
| 2025 | $3,878 | $396,112 | $263,491 | $132,621 |
| 2024 | $3,878 | $388,346 | $258,325 | $130,021 |
| 2023 | $3,795 | $380,732 | $253,260 | $127,472 |
| 2022 | $3,721 | $373,267 | $248,294 | $124,973 |
| 2021 | $3,648 | $365,949 | $243,426 | $122,523 |
| 2020 | $3,611 | $362,197 | $240,930 | $121,267 |
| 2019 | $3,539 | $355,096 | $236,206 | $118,890 |
| 2018 | $3,470 | $348,134 | $231,575 | $116,559 |
| 2017 | $3,400 | $341,308 | $227,034 | $114,274 |
| 2016 | $3,334 | $334,616 | $222,582 | $112,034 |
| 2015 | $3,282 | $329,590 | $219,238 | $110,352 |
| 2014 | $3,218 | $323,134 | $214,943 | $108,191 |
Source: Public Records
Map
Nearby Homes
- 29181 Via San Sebastian
- 25112 Armagosa Dr
- 24877 Nueva Vista Dr Unit 23
- 24839 Nueva Vista Dr Unit 5
- 25111 Adelanto Dr
- 24705 Queens Ct
- 24615 Kings Rd
- 24862 Vista Rancho
- 29592 Los Osos Dr
- 29282 Rue Cerise Unit 7
- 28721 Placida Ave
- 28621 Rancho Del Sol
- 28793 El Adolfo
- 28645 Via Pasatiempo
- 29901 Weatherwood
- 25552 Paseo la Vista Unit 20
- 25602 Paseo la Vista Unit 4
- 24515 El Sorrento
- 25575 Paseo la Vista Unit 75
- 1 O'Hill
- 29181 Aloma Ave
- 25032 Armagosa Dr
- 25031 Via Bonita
- 29171 Aloma Ave
- 25042 Armagosa Dr
- 29161 Aloma Ave Unit B
- 25052 Armagosa Dr
- 25021 Via Bonita
- 25061 Armagosa Dr
- 29172 Aloma Ave
- 29141 Aloma Ave
- 25062 Armagosa Dr
- 25011 Via Bonita
- 29162 Aloma Ave
- 25001 Monte Verde Dr
- 24971 Monte Verde Dr
- 25071 Armagosa Dr
- 25022 Nueva Vista Dr
- 25072 Armagosa Dr