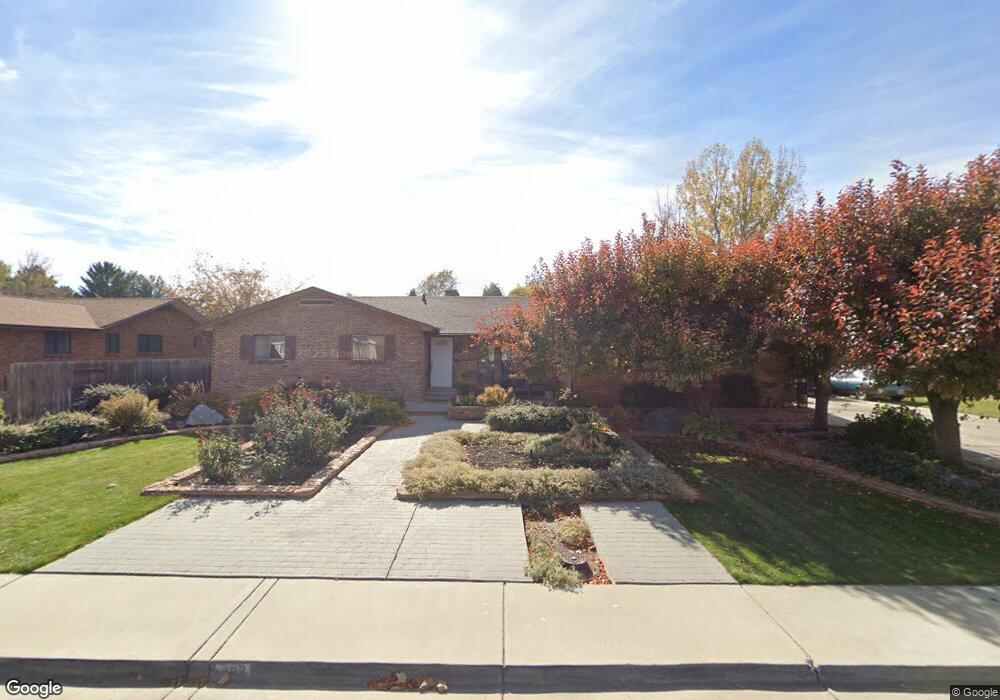
292 E 200 N Lindon, UT 84042
Estimated Value: $734,000 - $799,000
3
Beds
3
Baths
2,042
Sq Ft
$371/Sq Ft
Est. Value
About This Home
This home is located at 292 E 200 N, Lindon, UT 84042 and is currently estimated at $757,633, approximately $371 per square foot. 292 E 200 N is a home with nearby schools including Lindon Elementary School, Oak Canyon Junior High School, and Pleasant Grove High School.
Ownership History
Date
Name
Owned For
Owner Type
Purchase Details
Closed on
Mar 9, 2018
Sold by
Ireland Ward J
Bought by
Ireland Ward J and Ireland Leslie Diane
Current Estimated Value
Purchase Details
Closed on
Jul 30, 2014
Sold by
Ireland Raylene G
Bought by
Ireland Ward J and Ireland Raylene G
Purchase Details
Closed on
Dec 31, 2003
Sold by
Ireland Ward J and Ireland Raylene G
Bought by
Ireland Raylene G
Purchase Details
Closed on
Jan 2, 2002
Sold by
Ireland Raylene G
Bought by
Ireland Wade J and Ireland Raylene G
Create a Home Valuation Report for This Property
The Home Valuation Report is an in-depth analysis detailing your home's value as well as a comparison with similar homes in the area
Home Values in the Area
Average Home Value in this Area
Purchase History
| Date | Buyer | Sale Price | Title Company |
|---|---|---|---|
| Ireland Ward J | -- | Accommodation | |
| Ireland Ward J | -- | None Available | |
| Ireland Raylene G | -- | Title West Title Company | |
| Ireland Wade J | -- | Inwest Title Services Inc | |
| Ireland Raylene G | -- | Inwest Title Services Inc |
Source: Public Records
Tax History
| Year | Tax Paid | Tax Assessment Tax Assessment Total Assessment is a certain percentage of the fair market value that is determined by local assessors to be the total taxable value of land and additions on the property. | Land | Improvement |
|---|---|---|---|---|
| 2025 | $2,786 | $358,600 | -- | -- |
| 2024 | $2,786 | $343,420 | $0 | $0 |
| 2023 | $2,666 | $353,045 | $0 | $0 |
| 2022 | $2,652 | $339,185 | $0 | $0 |
| 2021 | $2,258 | $435,500 | $199,800 | $235,700 |
| 2020 | $2,111 | $400,800 | $178,400 | $222,400 |
| 2019 | $1,781 | $352,800 | $152,900 | $199,900 |
| 2018 | $1,658 | $309,700 | $135,900 | $173,800 |
| 2017 | $1,460 | $146,190 | $0 | $0 |
| 2016 | $1,385 | $128,315 | $0 | $0 |
| 2015 | $1,465 | $128,315 | $0 | $0 |
| 2014 | $1,263 | $109,560 | $0 | $0 |
Source: Public Records
Map
Nearby Homes
Your Personal Tour Guide
Ask me questions while you tour the home.