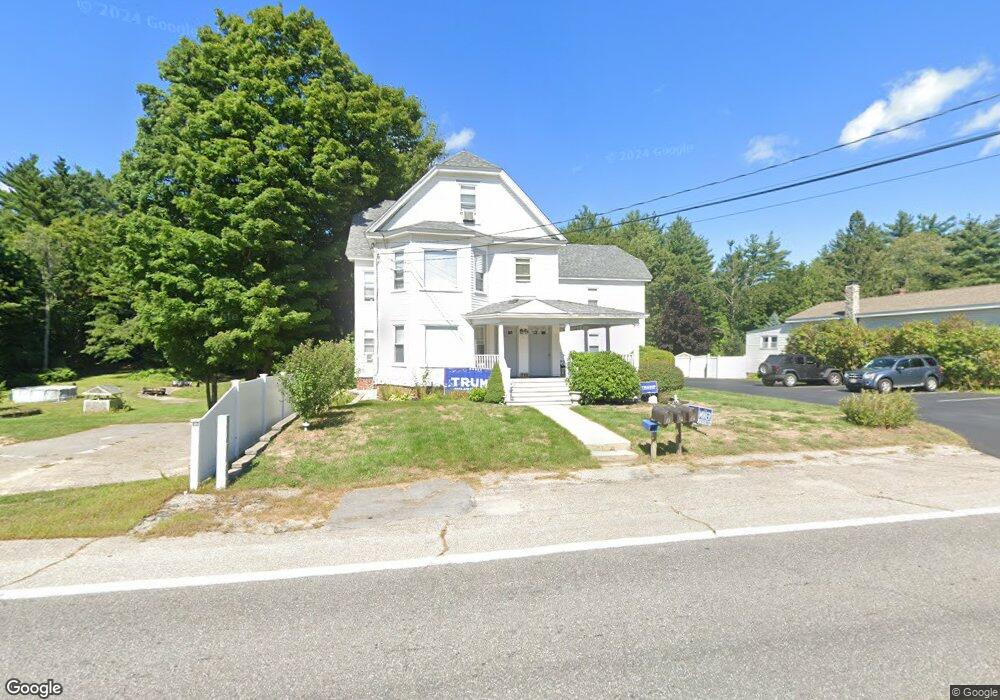
292 Main St Unit 2 Fremont, NH 03044
Estimated Value: $881,000 - $1,114,000
2
Beds
1
Bath
1,100
Sq Ft
$932/Sq Ft
Est. Value
About This Home
This home is located at 292 Main St Unit 2, Fremont, NH 03044 and is currently estimated at $1,025,333, approximately $932 per square foot. 292 Main St Unit 2 is a home located in Rockingham County with nearby schools including Ellis School.
Ownership History
Date
Name
Owned For
Owner Type
Purchase Details
Closed on
Feb 5, 2020
Sold by
Emery Marcia
Bought by
Paige 2019 T
Current Estimated Value
Purchase Details
Closed on
Sep 18, 2019
Sold by
Paige Pamela J
Bought by
Paige 2019 T
Purchase Details
Closed on
Mar 22, 2013
Sold by
Paige Pamela J
Bought by
Paige Pamela J and Emery Marcia
Home Financials for this Owner
Home Financials are based on the most recent Mortgage that was taken out on this home.
Original Mortgage
$239,200
Interest Rate
3.57%
Mortgage Type
Purchase Money Mortgage
Create a Home Valuation Report for This Property
The Home Valuation Report is an in-depth analysis detailing your home's value as well as a comparison with similar homes in the area
Home Values in the Area
Average Home Value in this Area
Purchase History
| Date | Buyer | Sale Price | Title Company |
|---|---|---|---|
| Paige 2019 T | -- | None Available | |
| Paige 2019 T | -- | -- | |
| Paige Pamela J | -- | -- |
Source: Public Records
Mortgage History
| Date | Status | Borrower | Loan Amount |
|---|---|---|---|
| Previous Owner | Paige Pamela J | $239,200 |
Source: Public Records
Tax History Compared to Growth
Tax History
| Year | Tax Paid | Tax Assessment Tax Assessment Total Assessment is a certain percentage of the fair market value that is determined by local assessors to be the total taxable value of land and additions on the property. | Land | Improvement |
|---|---|---|---|---|
| 2024 | $11,155 | $423,000 | $70,600 | $352,400 |
| 2023 | $9,979 | $423,000 | $70,600 | $352,400 |
| 2022 | $9,311 | $401,500 | $70,600 | $330,900 |
| 2021 | $8,961 | $401,500 | $70,600 | $330,900 |
| 2020 | $18,578 | $401,500 | $70,600 | $330,900 |
| 2019 | $6,388 | $270,600 | $48,400 | $222,200 |
| 2018 | $7,699 | $268,000 | $48,400 | $219,600 |
| 2017 | $4,395 | $265,800 | $48,400 | $217,400 |
| 2016 | $7,942 | $265,800 | $48,400 | $217,400 |
| 2015 | $7,708 | $265,800 | $48,400 | $217,400 |
| 2014 | $7,224 | $256,000 | $48,400 | $207,600 |
| 2013 | $7,170 | $251,500 | $48,400 | $203,100 |
Source: Public Records
Map
Nearby Homes
- 308 Main St
- 240 Main St
- 45 Whittier Dr
- 164 Hall Rd
- 188 Main St
- 54 Cavil Mill Rd
- 38 Bluefish Dr
- 454 Main St
- 94 Thunder Rd
- 32 Country Ln
- Lot 7-0 Sanborn Meadow Unit 7-0
- 564 Main St
- Lot 7-3 Sanborn Meadow Unit 7-3
- 21 Jennifer Ln
- Lot 7-2 Sanborn Meadow Unit 7-2
- 118 Hall Rd Unit 3
- 3 Margaret Ave
- 13 Huckleberry Rd
- 11 Mary Ave
- 6 Mildred Ave