292 State Route 186 N Humboldt, TN 38343
Estimated Value: $279,000 - $338,000
--
Bed
2
Baths
2,070
Sq Ft
$154/Sq Ft
Est. Value
About This Home
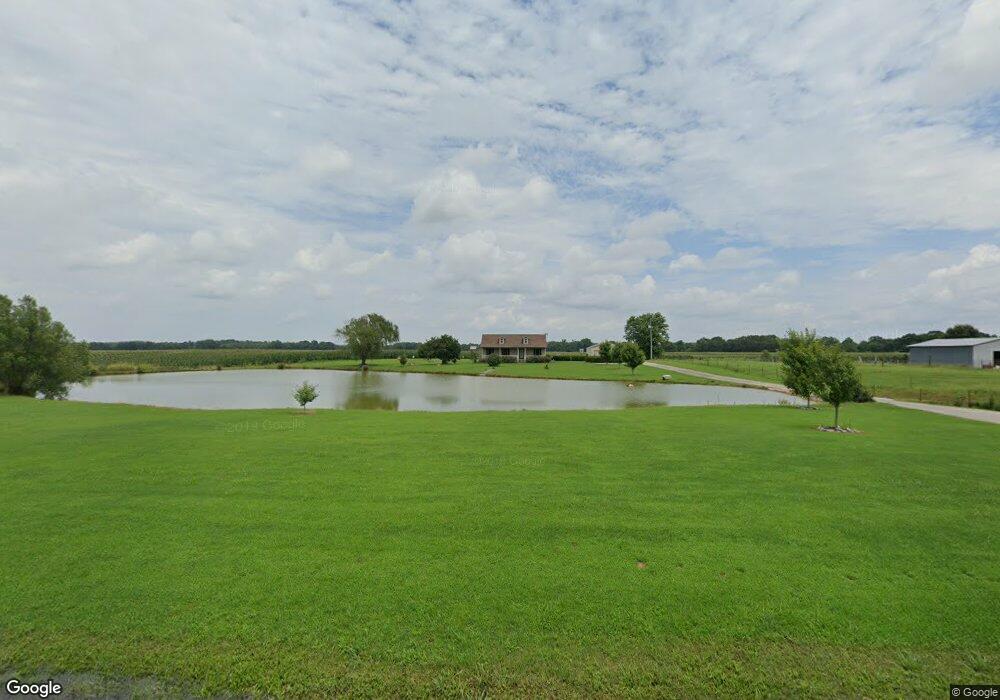
This home is located at 292 State Route 186 N, Humboldt, TN 38343 and is currently estimated at $318,508, approximately $153 per square foot. 292 State Route 186 N is a home located in Gibson County with nearby schools including Trenton Elementary School, Trenton Middle School, and Peabody High School.
Ownership History
Date
Name
Owned For
Owner Type
Purchase Details
Closed on
Mar 27, 2006
Sold by
Newell Robert William
Bought by
Cunningham Autumn
Current Estimated Value
Home Financials for this Owner
Home Financials are based on the most recent Mortgage that was taken out on this home.
Original Mortgage
$109,693
Outstanding Balance
$62,563
Interest Rate
6.23%
Estimated Equity
$255,945
Purchase Details
Closed on
Nov 8, 2005
Sold by
Newell Josh W
Bought by
Newell Robert William
Purchase Details
Closed on
Nov 12, 2003
Sold by
Newell Seresa R
Bought by
Newell Josh Warren
Purchase Details
Closed on
Jun 3, 2002
Sold by
Jordan Elizabeth S and Jordan Willi
Bought by
Newell Josh W and Newell Seresa R
Home Financials for this Owner
Home Financials are based on the most recent Mortgage that was taken out on this home.
Original Mortgage
$102,125
Interest Rate
6.85%
Purchase Details
Closed on
Jul 13, 1994
Bought by
Jordan Willam Benjamin and Jordan Elizabeth
Create a Home Valuation Report for This Property
The Home Valuation Report is an in-depth analysis detailing your home's value as well as a comparison with similar homes in the area
Home Values in the Area
Average Home Value in this Area
Purchase History
| Date | Buyer | Sale Price | Title Company |
|---|---|---|---|
| Cunningham Autumn | $107,500 | -- | |
| Newell Robert William | -- | -- | |
| Newell Josh Warren | -- | -- | |
| Newell Josh W | $107,500 | -- | |
| Jordan Willam Benjamin | $5,700 | -- |
Source: Public Records
Mortgage History
| Date | Status | Borrower | Loan Amount |
|---|---|---|---|
| Open | Jordan Willam Benjamin | $109,693 | |
| Previous Owner | Jordan Willam Benjamin | $102,125 |
Source: Public Records
Tax History Compared to Growth
Tax History
| Year | Tax Paid | Tax Assessment Tax Assessment Total Assessment is a certain percentage of the fair market value that is determined by local assessors to be the total taxable value of land and additions on the property. | Land | Improvement |
|---|---|---|---|---|
| 2024 | $1,783 | $83,050 | $9,400 | $73,650 |
| 2023 | $1,635 | $52,525 | $4,975 | $47,550 |
| 2022 | $1,523 | $50,050 | $4,975 | $45,075 |
| 2021 | $1,296 | $42,600 | $4,975 | $37,625 |
| 2020 | $817 | $42,600 | $4,975 | $37,625 |
| 2019 | $817 | $26,875 | $4,975 | $21,900 |
| 2018 | $862 | $27,250 | $4,975 | $22,275 |
| 2017 | $848 | $27,250 | $4,975 | $22,275 |
| 2016 | $763 | $27,250 | $4,975 | $22,275 |
| 2015 | -- | $24,525 | $4,975 | $19,550 |
| 2014 | -- | $24,525 | $4,975 | $19,550 |
Source: Public Records
Map
Nearby Homes
- 61 Tennessee 186
- 491 Tennessee 420
- 340 Gibson Hwy
- 152 Caraway Hills Rd
- 36 Casey Rd
- 411 Rozelle St
- 73 Oak Grove Rd
- 00 Rozelle St
- 0 Tennessee 186
- 222 Gibson Hwy
- 35 Parker Ln
- 0 Oak Leaf Dr Unit 231921
- 92 Dawson Bottom Rd
- 0 Booth Rd
- 102 Sanders Store Rd
- 195 Old Jackson Rd
- 152 Hunter Jones Rd
- 0 Humboldt Hwy
- 203 Bogle Loop
- 203 Bogle Loop Rd
- 288 State Route 186 N
- 293 State Route 186 N
- 295 State Route 186 N
- 295 Tennessee 186
- 291 State Route 186 N
- 291 Tennessee 186
- 289 State Route 186 N
- 285 State Route 186 N
- 287 State Route 186 N
- 283 State Route 186 N
- 281 State Route 186 N
- 314 State Route 186 N
- 307 State Route 186 N
- 271 Tennessee 186
- 271 State Route 186 N
- 276 State Route 186 N Unit 280
- 265 Tennessee 186
- 259 State Route 186 N
- 248 State Route 186 N
- 7 Jim Jackson Rd