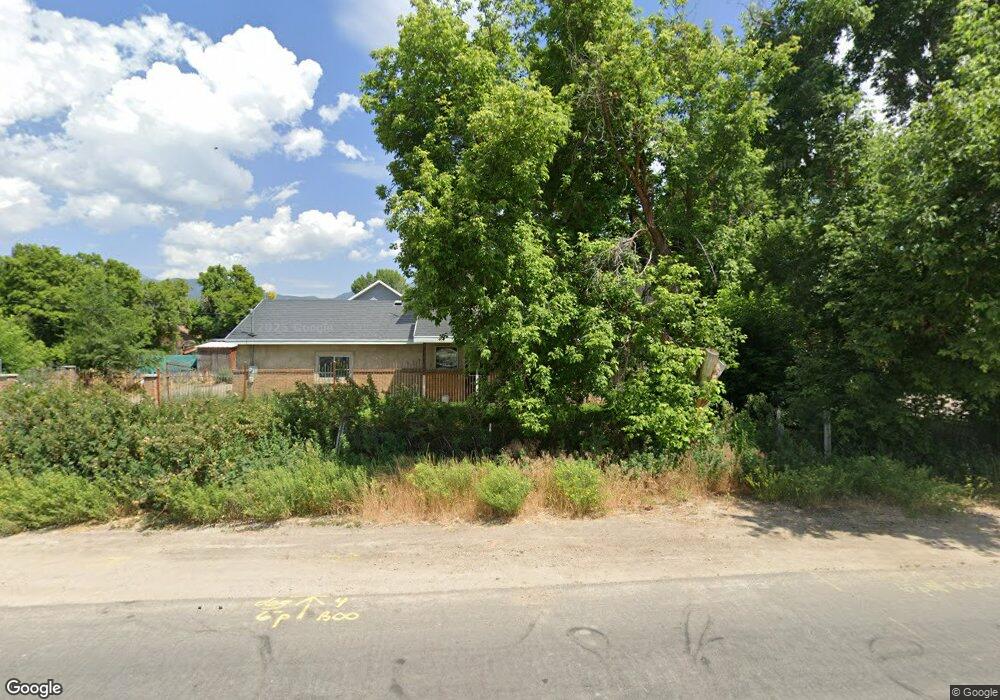
292 W Main St Midway, UT 84049
Estimated Value: $822,000 - $1,033,597
--
Bed
--
Bath
2,137
Sq Ft
$432/Sq Ft
Est. Value
About This Home
This home is located at 292 W Main St, Midway, UT 84049 and is currently estimated at $923,399, approximately $432 per square foot. 292 W Main St is a home with nearby schools including Midway Elementary School, Rocky Mountain Middle School, and Wasatch High School.
Ownership History
Date
Name
Owned For
Owner Type
Purchase Details
Closed on
Mar 31, 2022
Sold by
Lance Family Trust
Bought by
Lance Kegan James
Current Estimated Value
Home Financials for this Owner
Home Financials are based on the most recent Mortgage that was taken out on this home.
Original Mortgage
$246,000
Outstanding Balance
$232,068
Interest Rate
4.67%
Mortgage Type
Seller Take Back
Estimated Equity
$691,331
Create a Home Valuation Report for This Property
The Home Valuation Report is an in-depth analysis detailing your home's value as well as a comparison with similar homes in the area
Home Values in the Area
Average Home Value in this Area
Purchase History
| Date | Buyer | Sale Price | Title Company |
|---|---|---|---|
| Lance Kegan James | -- | None Listed On Document |
Source: Public Records
Mortgage History
| Date | Status | Borrower | Loan Amount |
|---|---|---|---|
| Open | Lance Kegan James | $246,000 |
Source: Public Records
Tax History Compared to Growth
Tax History
| Year | Tax Paid | Tax Assessment Tax Assessment Total Assessment is a certain percentage of the fair market value that is determined by local assessors to be the total taxable value of land and additions on the property. | Land | Improvement |
|---|---|---|---|---|
| 2025 | $3,916 | $772,660 | $300,000 | $472,660 |
| 2024 | $3,871 | $772,660 | $300,000 | $472,660 |
| 2023 | $3,871 | $747,950 | $200,000 | $547,950 |
| 2022 | $4,125 | $747,950 | $200,000 | $547,950 |
| 2021 | $2,430 | $340,477 | $150,000 | $190,477 |
| 2020 | $2,101 | $285,477 | $95,000 | $190,477 |
| 2019 | $1,922 | $157,012 | $0 | $0 |
| 2018 | $1,922 | $157,012 | $0 | $0 |
| 2017 | $1,775 | $144,147 | $0 | $0 |
Source: Public Records
Map
Nearby Homes
- 271 W Main St
- 33 N 200 W
- 360 W 200 N
- 320 Pine Canyon Rd
- 53 W 300 S
- 103 E Main St
- 115 S 100 E Unit 4
- 404 Cottage Creek Ct
- Geneva Plan at Bonner Meadows
- Woodland Plan at Bonner Meadows
- Montreaux Plan at Bonner Meadows
- Moritz Plan at Bonner Meadows
- Rhine Plan at Bonner Meadows
- Zurich Plan at Bonner Meadows
- Bern Plan at Bonner Meadows
- 165 S 100 E Unit 1
- 165 S 100 E
- Lucerne Plan at Bonner Meadows
- 115 E 100 N
- 670 W 200 N