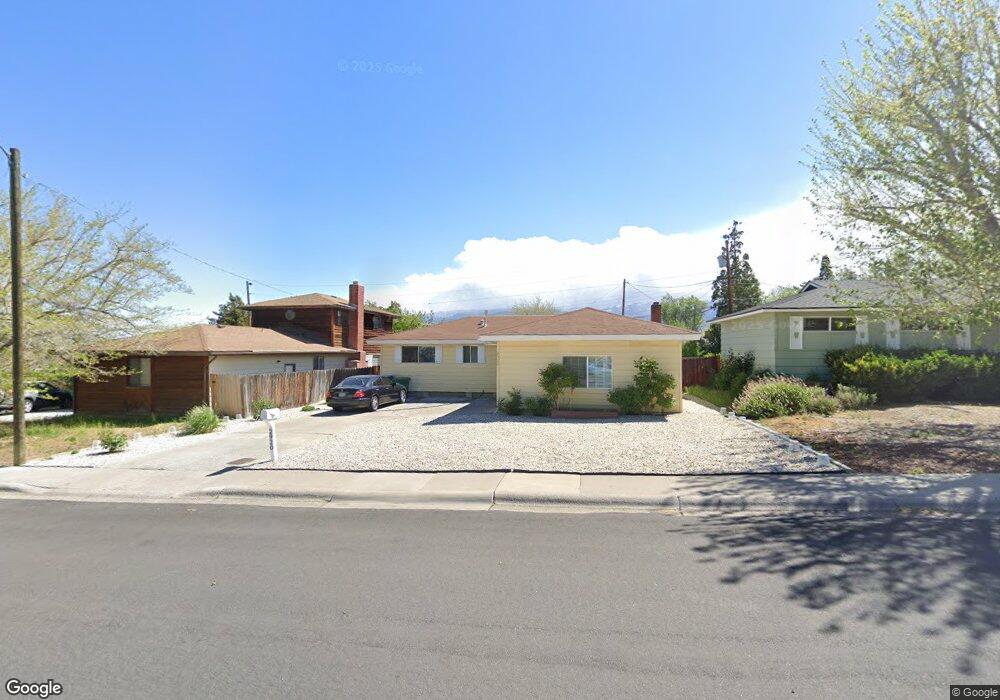
2920 Apollo Way Reno, NV 89503
Kings Row NeighborhoodEstimated Value: $432,000 - $492,000
3
Beds
2
Baths
1,176
Sq Ft
$386/Sq Ft
Est. Value
About This Home
This home is located at 2920 Apollo Way, Reno, NV 89503 and is currently estimated at $454,075, approximately $386 per square foot. 2920 Apollo Way is a home located in Washoe County with nearby schools including Mamie Towles Elementary School, Archie Clayton Pre-AP Academy, and Robert McQueen High School.
Ownership History
Date
Name
Owned For
Owner Type
Purchase Details
Closed on
Jul 16, 2013
Sold by
Reid Steven K and Vasquez Zaiann Emily
Bought by
Reid Steven K
Current Estimated Value
Home Financials for this Owner
Home Financials are based on the most recent Mortgage that was taken out on this home.
Original Mortgage
$155,875
Outstanding Balance
$113,344
Interest Rate
3.92%
Mortgage Type
New Conventional
Estimated Equity
$340,731
Purchase Details
Closed on
Jun 12, 2003
Sold by
County Of Washoe
Bought by
Berrum Bill and State Of Nevada
Purchase Details
Closed on
Nov 30, 1998
Sold by
Parker Michael F
Bought by
Reid Steven K and Vasquez Zaiann Emily
Home Financials for this Owner
Home Financials are based on the most recent Mortgage that was taken out on this home.
Original Mortgage
$102,560
Interest Rate
9.25%
Purchase Details
Closed on
Feb 19, 1997
Sold by
Parker Lewis F
Bought by
Parker Michael F and Lewis F Parker 1997 Nevada Trust
Create a Home Valuation Report for This Property
The Home Valuation Report is an in-depth analysis detailing your home's value as well as a comparison with similar homes in the area
Home Values in the Area
Average Home Value in this Area
Purchase History
| Date | Buyer | Sale Price | Title Company |
|---|---|---|---|
| Reid Steven K | -- | Title Source Inc | |
| Berrum Bill | -- | -- | |
| Reid Steven K | $128,500 | Founders Title Co Of Nevada | |
| Parker Michael F | -- | -- |
Source: Public Records
Mortgage History
| Date | Status | Borrower | Loan Amount |
|---|---|---|---|
| Open | Reid Steven K | $155,875 | |
| Previous Owner | Reid Steven K | $102,560 | |
| Closed | Reid Steven K | $25,640 |
Source: Public Records
Tax History Compared to Growth
Tax History
| Year | Tax Paid | Tax Assessment Tax Assessment Total Assessment is a certain percentage of the fair market value that is determined by local assessors to be the total taxable value of land and additions on the property. | Land | Improvement |
|---|---|---|---|---|
| 2025 | $926 | $60,086 | $39,795 | $20,291 |
| 2024 | $926 | $57,532 | $37,485 | $20,047 |
| 2023 | $900 | $57,736 | $39,200 | $18,536 |
| 2022 | $874 | $46,527 | $31,500 | $15,027 |
| 2021 | $849 | $35,716 | $21,245 | $14,471 |
| 2020 | $822 | $34,421 | $19,985 | $14,436 |
| 2019 | $798 | $33,946 | $20,300 | $13,646 |
| 2018 | $761 | $27,101 | $14,455 | $12,646 |
| 2017 | $739 | $25,609 | $12,915 | $12,694 |
| 2016 | $720 | $24,071 | $11,340 | $12,731 |
| 2015 | $718 | $22,221 | $9,625 | $12,596 |
| 2014 | $697 | $20,519 | $8,575 | $11,944 |
| 2013 | -- | $18,412 | $6,125 | $12,287 |
Source: Public Records
Map
Nearby Homes
- 3055 Slater Ct
- 1230 Freddie Ct
- 1350 Marne Dr
- 2718 Powder Dr
- 1270 Searchlite Ct
- 1455 Exeter Way
- 1169 Wagon Wheel Cir
- 1265 Searchlite Ct
- 730 James Ct
- 3887 Allen Glen Dr
- 1200 Wild Oak Ct
- 3570 W 7th St
- 670 Nancy Cir
- 2595 W 7th St
- 3235 Bryan St
- 3465 Yosemite Place
- 610 Akard Cir
- 2815 Severn Dr
- 3525 Zion Ln
- 2645 Emily St
- 2926 Apollo Way
- 2910 Apollo Way
- 2985 Slater Ave
- 2930 Apollo Way
- 2901R Slater Ave
- 2955 Slater Ave
- 2901 Slater Ave
- 2935 Slater Ave
- 2995 Slater Ave
- 3021 Slater Ct
- 2936 Apollo Way
- 3027 Slater Ct
- 3001 Slater Ave
- 2940 Apollo Way
- 3015 Slater Ave
- 3031 Slater Ct
- 2910 Slater Ave
- 2920 Slater Ave
- 2960 Slater Ave
- 2970 Slater Ave