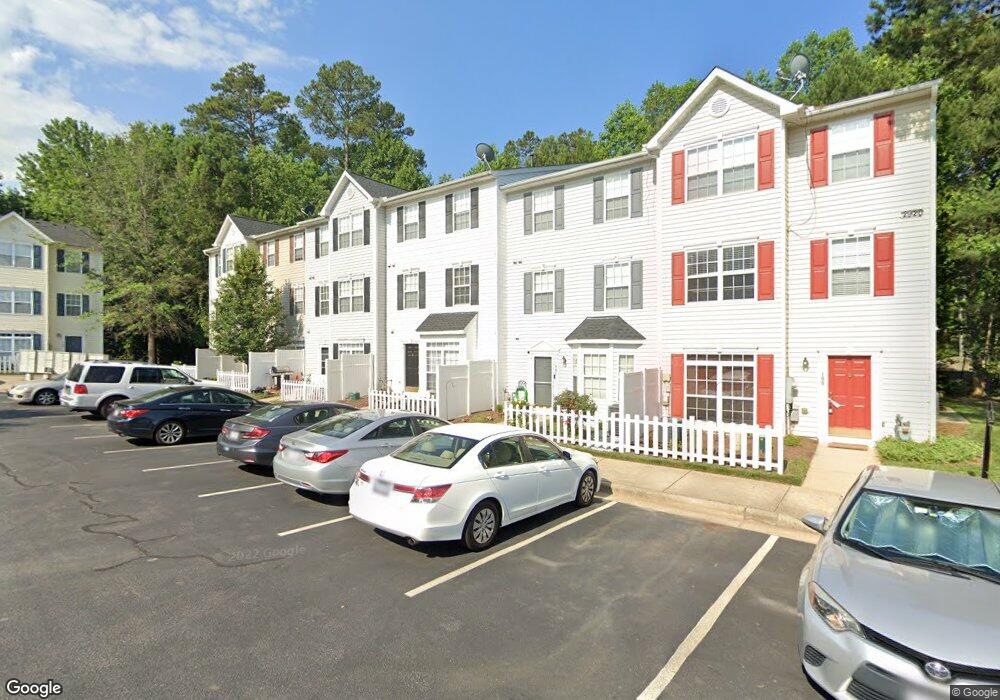
2920 Barrymore St Unit 110 Raleigh, NC 27603
South Raleigh NeighborhoodEstimated Value: $285,000 - $323,000
--
Bed
3
Baths
1,740
Sq Ft
$172/Sq Ft
Est. Value
About This Home
This home is located at 2920 Barrymore St Unit 110, Raleigh, NC 27603 and is currently estimated at $299,876, approximately $172 per square foot. 2920 Barrymore St Unit 110 is a home located in Wake County with nearby schools including Dillard Drive Magnet Elementary School, Dillard Drive Magnet Middle School, and Longleaf School Of The Arts.
Ownership History
Date
Name
Owned For
Owner Type
Purchase Details
Closed on
Nov 20, 2017
Sold by
Brinkley Nathan Thomas
Bought by
Fidelino Alfie
Current Estimated Value
Purchase Details
Closed on
Nov 5, 2015
Sold by
Brinkley Nicholas G and Brinkley Laura Elaine
Bought by
Brinkley Nathan Thomas
Home Financials for this Owner
Home Financials are based on the most recent Mortgage that was taken out on this home.
Original Mortgage
$118,000
Interest Rate
4.25%
Mortgage Type
Adjustable Rate Mortgage/ARM
Purchase Details
Closed on
May 30, 2006
Sold by
Camden Crossing Townhomes Llc
Bought by
Brinkley Nicholas G
Home Financials for this Owner
Home Financials are based on the most recent Mortgage that was taken out on this home.
Original Mortgage
$143,550
Interest Rate
6.41%
Mortgage Type
FHA
Create a Home Valuation Report for This Property
The Home Valuation Report is an in-depth analysis detailing your home's value as well as a comparison with similar homes in the area
Home Values in the Area
Average Home Value in this Area
Purchase History
| Date | Buyer | Sale Price | Title Company |
|---|---|---|---|
| Fidelino Alfie | $135,000 | None Available | |
| Brinkley Nathan Thomas | $118,000 | Attorney | |
| Brinkley Nicholas G | $146,000 | None Available |
Source: Public Records
Mortgage History
| Date | Status | Borrower | Loan Amount |
|---|---|---|---|
| Previous Owner | Brinkley Nathan Thomas | $118,000 | |
| Previous Owner | Brinkley Nicholas G | $143,550 |
Source: Public Records
Tax History Compared to Growth
Tax History
| Year | Tax Paid | Tax Assessment Tax Assessment Total Assessment is a certain percentage of the fair market value that is determined by local assessors to be the total taxable value of land and additions on the property. | Land | Improvement |
|---|---|---|---|---|
| 2025 | $2,474 | $281,397 | -- | $281,397 |
| 2024 | $2,464 | $281,397 | $0 | $281,397 |
| 2023 | $2,034 | $184,725 | $0 | $184,725 |
| 2022 | $1,890 | $184,725 | $0 | $184,725 |
| 2021 | $1,817 | $184,725 | $0 | $184,725 |
| 2020 | $1,784 | $184,725 | $0 | $184,725 |
| 2019 | $1,586 | $135,105 | $0 | $135,105 |
| 2018 | $1,496 | $135,105 | $0 | $135,105 |
| 2017 | $1,426 | $135,105 | $0 | $135,105 |
| 2016 | $1,396 | $135,105 | $0 | $135,105 |
| 2015 | $1,585 | $151,089 | $0 | $151,089 |
| 2014 | $1,503 | $151,089 | $0 | $151,089 |
Source: Public Records
Map
Nearby Homes
- 3040 Barrymore St Unit 108
- 3115 Tryon Rd
- 3109 Tryon Rd
- 3113 Tryon Rd
- 2505 Ferndown Ct
- 3223 Tryon Rd
- 2901 Alder Ridge Ln
- 2524 Beech Gap Ct
- 2201 Mountain Mist Ct Unit 103
- 2745 Sterling Park Dr
- 1901 Trailwood Heights Ln Unit 204
- 1901 Trailwood Heights Ln Unit 304
- 2639 Broad Oaks Place Unit 21
- 2271 Trailwood Valley Cir
- 2607 Sterling Park Dr
- 2950 Trailwood Pines Ln Unit 104
- 2228 Trailwood Valley Cir
- 2220 Trailwood Valley Cir
- 3020 Centennial Woods Dr Unit 101
- 2000 University Woods Rd Unit 303
- 2920 Barrymore St Unit 111
- 2920 Barrymore St Unit 109
- 2920 Barrymore St Unit 108
- 2920 Barrymore St Unit 107
- 2920 Barrymore St Unit 106
- 2920 Barrymore St Unit 105
- 2920 Barrymore St Unit 104
- 2920 Barrymore St Unit 103
- 2920 Barrymore St Unit 102
- 2920 Barrymore St Unit 101
- 2920 Barrymore St Unit 100
- 2920 Barrymore St Unit 7
- 2920 Barrymore St
- 3010 Barrymore St Unit 111
- 3010 Barrymore St Unit 110
- 3010 Barrymore St Unit 109
- 3010 Barrymore St Unit 108
- 3010 Barrymore St Unit 107
- 3010 Barrymore St Unit 106
- 3010 Barrymore St Unit 105