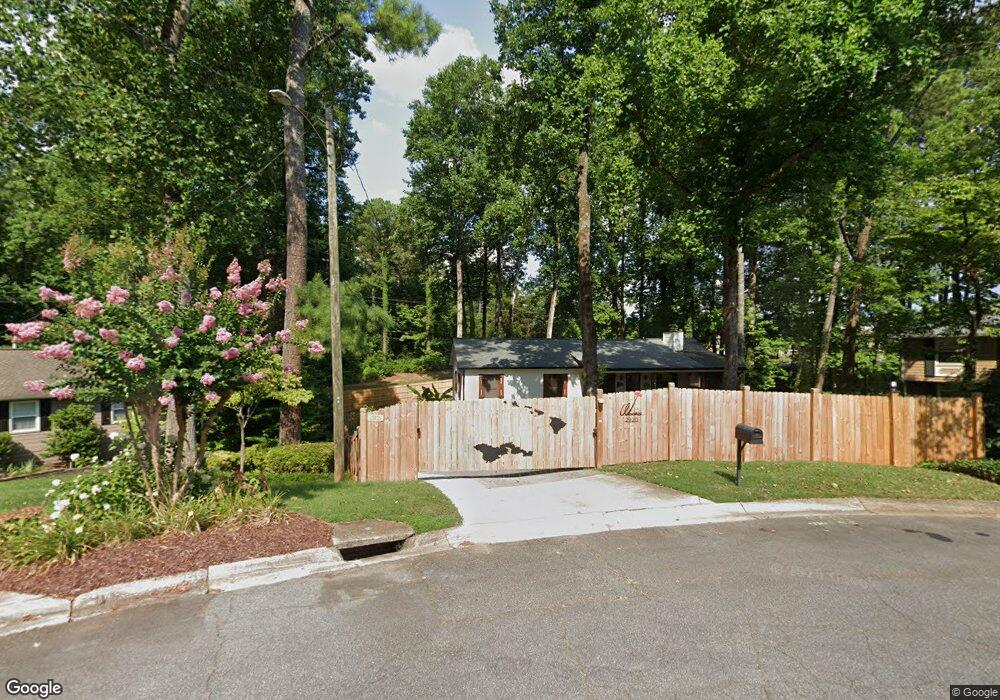
2920 Woodgate Ct Unit 1 Marietta, GA 30066
Sandy Plains NeighborhoodEstimated Value: $327,377 - $392,000
3
Beds
2
Baths
1,376
Sq Ft
$264/Sq Ft
Est. Value
About This Home
This home is located at 2920 Woodgate Ct Unit 1, Marietta, GA 30066 and is currently estimated at $362,844, approximately $263 per square foot. 2920 Woodgate Ct Unit 1 is a home located in Cobb County with nearby schools including Bells Ferry Elementary School, Daniell Middle School, and Sprayberry High School.
Ownership History
Date
Name
Owned For
Owner Type
Purchase Details
Closed on
Oct 29, 2002
Sold by
Hirschler David G and Hirschler Karen L
Bought by
Weeks Jason
Current Estimated Value
Home Financials for this Owner
Home Financials are based on the most recent Mortgage that was taken out on this home.
Original Mortgage
$134,900
Outstanding Balance
$56,462
Interest Rate
6.01%
Mortgage Type
New Conventional
Estimated Equity
$306,382
Purchase Details
Closed on
Aug 29, 1997
Sold by
Hargrove Barbara M and Hargrove Robert
Bought by
Hirshler David G
Home Financials for this Owner
Home Financials are based on the most recent Mortgage that was taken out on this home.
Original Mortgage
$109,700
Interest Rate
7.39%
Mortgage Type
New Conventional
Purchase Details
Closed on
Jan 11, 1996
Sold by
Secretary Of Hud
Bought by
Hargrave Barbara M Robert
Create a Home Valuation Report for This Property
The Home Valuation Report is an in-depth analysis detailing your home's value as well as a comparison with similar homes in the area
Home Values in the Area
Average Home Value in this Area
Purchase History
| Date | Buyer | Sale Price | Title Company |
|---|---|---|---|
| Weeks Jason | $142,000 | -- | |
| Hirshler David G | $115,500 | -- | |
| Hargrave Barbara M Robert | -- | -- |
Source: Public Records
Mortgage History
| Date | Status | Borrower | Loan Amount |
|---|---|---|---|
| Open | Weeks Jason | $134,900 | |
| Previous Owner | Hirshler David G | $109,700 | |
| Closed | Hargrave Barbara M Robert | $0 |
Source: Public Records
Tax History Compared to Growth
Tax History
| Year | Tax Paid | Tax Assessment Tax Assessment Total Assessment is a certain percentage of the fair market value that is determined by local assessors to be the total taxable value of land and additions on the property. | Land | Improvement |
|---|---|---|---|---|
| 2024 | -- | $116,724 | $28,000 | $88,724 |
| 2023 | $0 | $116,724 | $28,000 | $88,724 |
| 2022 | $2,293 | $97,500 | $24,000 | $73,500 |
| 2021 | $2,170 | $91,868 | $22,000 | $69,868 |
| 2020 | $1,717 | $71,160 | $20,000 | $51,160 |
| 2019 | $1,717 | $71,160 | $20,000 | $51,160 |
| 2018 | $1,685 | $69,684 | $20,000 | $49,684 |
| 2017 | $1,358 | $57,712 | $20,000 | $37,712 |
| 2016 | $1,360 | $57,712 | $20,000 | $37,712 |
| 2015 | $1,185 | $49,060 | $16,000 | $33,060 |
| 2014 | $1,195 | $49,060 | $0 | $0 |
Source: Public Records
Map
Nearby Homes
- 2850 Seagrave Way
- 3171 Vickery Dr NE
- 628 Verney Dr
- 3195 Vickery Dr NE
- 2659 Bethel Ct
- 3216 Guynelle Dr
- 336 Rockmoor Trail
- 3275 Hilltop Cir
- 3265 Hilltop Cir
- 692 Suholden Cir
- 2813 New South Dr
- 2813 New Dr S
- 921 Chesterfield Dr
- 2944 Piedmont Dr
- 3278 Fowler Dr
- 2789 Cottonwood Dr
- 605 Embry Ln
- 159 Lloyd Dr
- 183 Kathryn Ln Unit 3
- 2910 Woodgate Ct
- 2930 Woodgate Ct
- 0 Woodgate Ct Unit 8494004
- 611 Woodgate Dr
- 591 Woodgate Dr
- 3202 Rimrock Dr
- 2931 Woodgate Ct Unit 1
- 571 Woodgate Dr Unit 1
- 2911 Woodgate Ct
- 3000 Mulberry St
- 3204 Rimrock Dr
- 2921 Woodgate Ct
- 3206 Rimrock Dr
- 2901 Woodgate Ct
- 3208 Rimrock Dr
- 531 Woodgate Dr Unit 1
- 0 Mulberry St Unit 7577652
- 0 Mulberry St
- 3210 Rimrock Dr
- 3002 Mulberry St