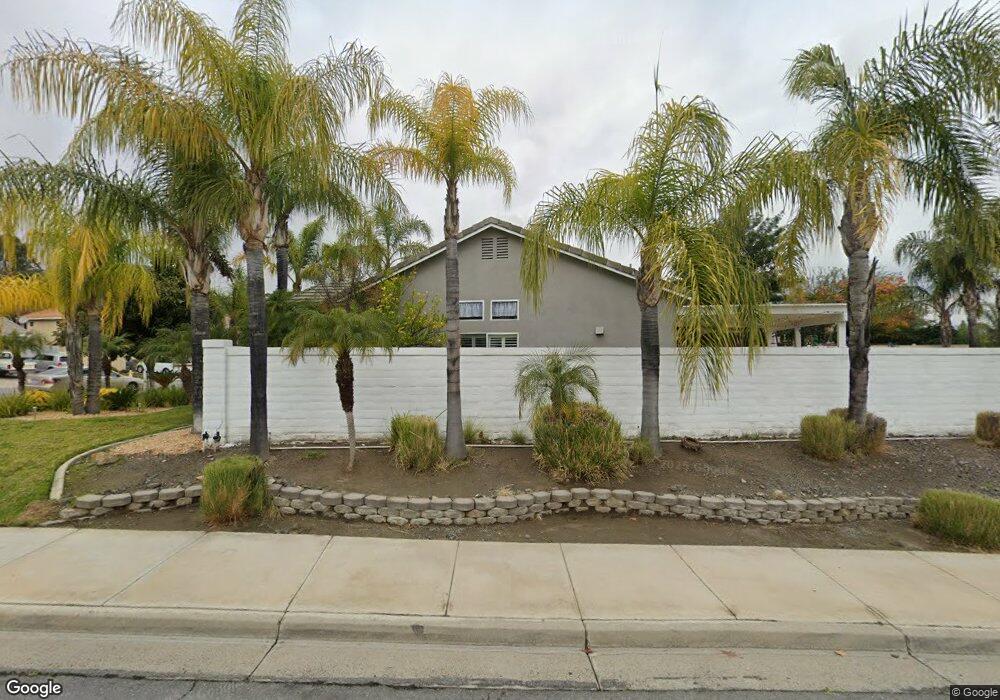
29200 Outrigger St Lake Elsinore, CA 92530
Lake View District NeighborhoodEstimated Value: $538,158 - $590,000
3
Beds
2
Baths
1,520
Sq Ft
$374/Sq Ft
Est. Value
About This Home
This home is located at 29200 Outrigger St, Lake Elsinore, CA 92530 and is currently estimated at $568,040, approximately $373 per square foot. 29200 Outrigger St is a home located in Riverside County with nearby schools including Rice Canyon Elementary School, Terra Cotta Middle School, and Lakeside High School.
Ownership History
Date
Name
Owned For
Owner Type
Purchase Details
Closed on
Feb 11, 2019
Sold by
Cooker Lorraine M
Bought by
Cooker Lorraine M and Lorraine M Crooker Living Trust
Current Estimated Value
Home Financials for this Owner
Home Financials are based on the most recent Mortgage that was taken out on this home.
Original Mortgage
$251,500
Outstanding Balance
$220,663
Interest Rate
4.4%
Mortgage Type
New Conventional
Estimated Equity
$347,377
Purchase Details
Closed on
Aug 23, 2017
Sold by
Crooker Lorraine Marie
Bought by
Crooker Lorraine M and The Lorraine M Crooker Living Trust
Purchase Details
Closed on
Jun 24, 1994
Sold by
Turner Scot C and Turner Janine H
Bought by
Crooker Lorraine Marie
Home Financials for this Owner
Home Financials are based on the most recent Mortgage that was taken out on this home.
Original Mortgage
$126,010
Interest Rate
7.5%
Mortgage Type
FHA
Create a Home Valuation Report for This Property
The Home Valuation Report is an in-depth analysis detailing your home's value as well as a comparison with similar homes in the area
Home Values in the Area
Average Home Value in this Area
Purchase History
| Date | Buyer | Sale Price | Title Company |
|---|---|---|---|
| Cooker Lorraine M | -- | First American Title Company | |
| Crooker Lorraine M | -- | First American Title Company | |
| Crooker Lorraine M | -- | None Available | |
| Crooker Lorraine Marie | $127,045 | Old Republic Title Company |
Source: Public Records
Mortgage History
| Date | Status | Borrower | Loan Amount |
|---|---|---|---|
| Open | Crooker Lorraine M | $251,500 | |
| Closed | Crooker Lorraine Marie | $126,010 |
Source: Public Records
Tax History Compared to Growth
Tax History
| Year | Tax Paid | Tax Assessment Tax Assessment Total Assessment is a certain percentage of the fair market value that is determined by local assessors to be the total taxable value of land and additions on the property. | Land | Improvement |
|---|---|---|---|---|
| 2025 | $2,119 | $210,925 | $50,371 | $160,554 |
| 2023 | $2,119 | $202,736 | $48,416 | $154,320 |
| 2022 | $2,049 | $198,762 | $47,467 | $151,295 |
| 2021 | $2,008 | $194,866 | $46,537 | $148,329 |
| 2020 | $1,987 | $192,869 | $46,060 | $146,809 |
| 2019 | $2,898 | $189,088 | $45,157 | $143,931 |
| 2018 | $2,860 | $185,381 | $44,272 | $141,109 |
| 2017 | $2,822 | $181,747 | $43,404 | $138,343 |
| 2016 | $2,753 | $178,184 | $42,553 | $135,631 |
| 2015 | $2,733 | $175,510 | $41,915 | $133,595 |
| 2014 | $3,108 | $172,074 | $41,095 | $130,979 |
Source: Public Records
Map
Nearby Homes
- 29228 Northpointe St
- 29140 Ocotillo Dr
- 29193 Sunswept Dr
- 15344 Regatta Way
- 186 S Massachusetts St
- 127 N Massachusetts St
- 802 Napa Ct
- 32015 Bourges St
- 15505 Starview St
- 15139 Camphor Way
- 3329 Spruce St
- 29224 Sandpiper Dr
- 15026 Navel Way
- 300 Date St
- 29054 Palm View St
- 15062 Amorose St
- 15139 Knollwood St
- 3652 Ash St
- 13 Ingall
- 15 Kee Ave
- 29196 Outrigger St
- 29253 Northpointe St
- 29192 Outrigger St
- 29268 Northpointe St
- 29249 Northpointe St
- 29264 Northpointe St
- 29272 Northpointe St
- 29167 Outrigger St
- 29188 Outrigger St
- 29163 Outrigger St
- 29171 Outrigger St
- 29260 Northpointe St
- 29002 Spindrift Cir
- 29159 Outrigger St
- 29245 Northpointe St
- 29276 Northpointe St
- 29175 Outrigger St
- 29256 Northpointe St
- 29155 Outrigger St
- 29004 Spindrift Cir