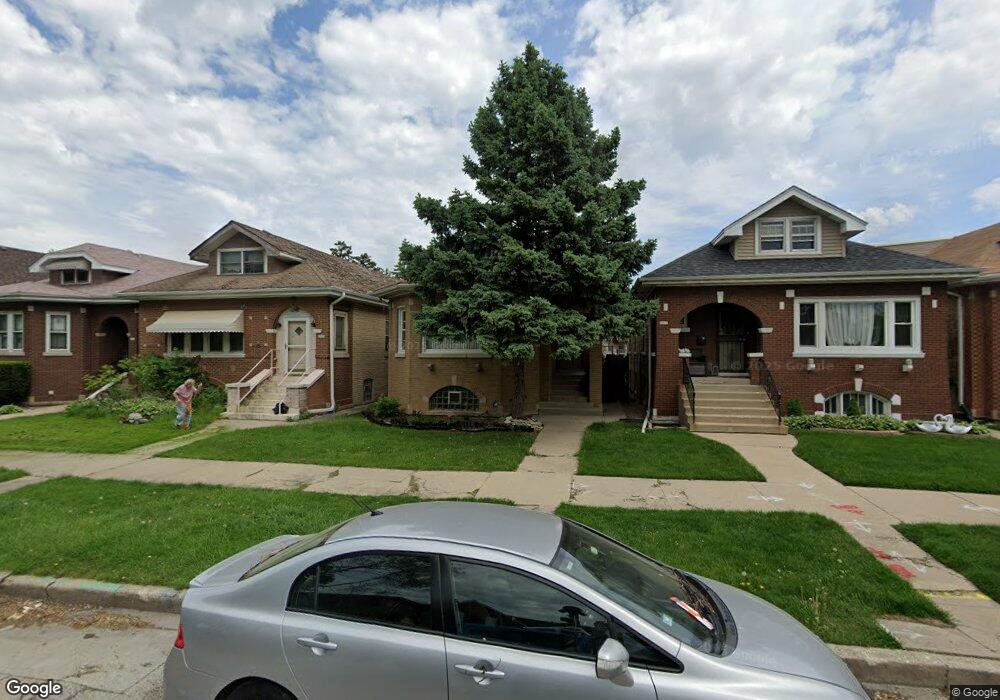
2921 N Lotus Ave Chicago, IL 60641
Cragin NeighborhoodEstimated Value: $351,000 - $383,750
4
Beds
2
Baths
1,108
Sq Ft
$329/Sq Ft
Est. Value
About This Home
This home is located at 2921 N Lotus Ave, Chicago, IL 60641 and is currently estimated at $364,188, approximately $328 per square foot. 2921 N Lotus Ave is a home located in Cook County with nearby schools including Schubert Elementary School, Northwest Middle School, and Foreman College and Career Academy.
Ownership History
Date
Name
Owned For
Owner Type
Purchase Details
Closed on
Nov 24, 1999
Sold by
Montanez Miriam
Bought by
Montanez Jose and Montanez Miriam
Current Estimated Value
Home Financials for this Owner
Home Financials are based on the most recent Mortgage that was taken out on this home.
Original Mortgage
$146,500
Outstanding Balance
$41,313
Interest Rate
6.75%
Estimated Equity
$322,875
Purchase Details
Closed on
Mar 22, 1996
Sold by
Rodriguez Jose L and Morales Nancy
Bought by
Montanez Miriam
Purchase Details
Closed on
Nov 17, 1995
Sold by
Kniazuk Maria and Kniazuk Ryszard
Bought by
Montanez Miriam and Morales Nancy
Home Financials for this Owner
Home Financials are based on the most recent Mortgage that was taken out on this home.
Original Mortgage
$148,109
Interest Rate
7.44%
Mortgage Type
FHA
Create a Home Valuation Report for This Property
The Home Valuation Report is an in-depth analysis detailing your home's value as well as a comparison with similar homes in the area
Home Values in the Area
Average Home Value in this Area
Purchase History
| Date | Buyer | Sale Price | Title Company |
|---|---|---|---|
| Montanez Jose | -- | -- | |
| Montanez Miriam | -- | -- | |
| Montanez Miriam | $150,000 | -- |
Source: Public Records
Mortgage History
| Date | Status | Borrower | Loan Amount |
|---|---|---|---|
| Open | Montanez Jose | $146,500 | |
| Previous Owner | Montanez Miriam | $148,109 |
Source: Public Records
Tax History Compared to Growth
Tax History
| Year | Tax Paid | Tax Assessment Tax Assessment Total Assessment is a certain percentage of the fair market value that is determined by local assessors to be the total taxable value of land and additions on the property. | Land | Improvement |
|---|---|---|---|---|
| 2024 | $4,156 | $30,611 | $6,993 | $23,618 |
| 2023 | $4,029 | $24,200 | $5,670 | $18,530 |
| 2022 | $4,029 | $24,200 | $5,670 | $18,530 |
| 2021 | $3,958 | $23,000 | $5,670 | $17,330 |
| 2020 | $4,182 | $21,866 | $4,725 | $17,141 |
| 2019 | $4,250 | $24,569 | $4,725 | $19,844 |
| 2018 | $5,380 | $30,655 | $4,725 | $25,930 |
| 2017 | $4,052 | $22,186 | $4,158 | $18,028 |
| 2016 | $3,946 | $22,186 | $4,158 | $18,028 |
| 2015 | $3,587 | $22,186 | $4,158 | $18,028 |
| 2014 | $3,598 | $21,947 | $3,780 | $18,167 |
| 2013 | $3,516 | $21,947 | $3,780 | $18,167 |
Source: Public Records
Map
Nearby Homes
- 3036 N Long Ave
- 5303 W George St
- 5254 W Wolfram St
- 5243 W Oakdale Ave
- 5335 W Barry Ave
- 3036 N Luna Ave
- 5505 W Parker Ave
- 5534 W Barry Ave
- 4918-22 W Diversey Ave
- 5244 W Barry Ave
- 2851 N Major Ave
- 5233 W Parker Ave
- 3043 N Laramie Ave Unit 2
- 3045 N Laramie Ave Unit 2
- 5330 W Drummond Place
- 5435 W Melrose St
- 2859 N Mango Ave
- 5512 W Wrightwood Ave
- 5121 W Diversey Ave Unit 3N
- 2735 N Mango Ave
- 2917 N Lotus Ave
- 2923 N Lotus Ave
- 2915 N Lotus Ave
- 2911 N Lotus Ave
- 2929 N Lotus Ave
- 2909 N Lotus Ave
- 2933 N Lotus Ave
- 2918 N Long Ave
- 2916 N Long Ave
- 2905 N Lotus Ave Unit 2ND
- 2905 N Lotus Ave
- 2924 N Long Ave
- 2912 N Long Ave
- 2910 N Long Ave
- 2937 N Lotus Ave
- 2914 N Lotus Ave
- 2928 N Long Ave
- 2901 N Lotus Ave
- 2906 N Long Ave
- 2912 N Lotus Ave