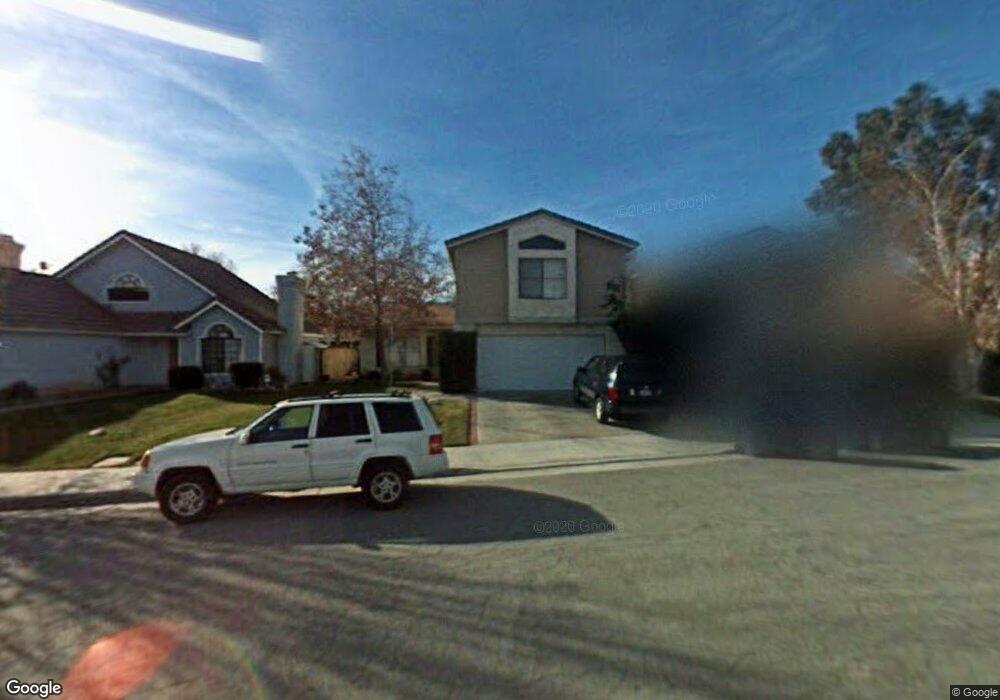
29219 Rangewood Rd Castaic, CA 91384
Estimated Value: $733,334 - $787,000
4
Beds
3
Baths
1,621
Sq Ft
$467/Sq Ft
Est. Value
About This Home
This home is located at 29219 Rangewood Rd, Castaic, CA 91384 and is currently estimated at $757,584, approximately $467 per square foot. 29219 Rangewood Rd is a home located in Los Angeles County with nearby schools including Live Oak Elementary School, Castaic Middle School, and Valencia High School.
Ownership History
Date
Name
Owned For
Owner Type
Purchase Details
Closed on
Jun 13, 2024
Sold by
Seeley Cheridah J
Bought by
Seeley/Lignier Family Trust and Seeley
Current Estimated Value
Purchase Details
Closed on
Dec 11, 2018
Sold by
Seely Cheridah J and Seeley Cheridah
Bought by
Seeley Cheridah J
Home Financials for this Owner
Home Financials are based on the most recent Mortgage that was taken out on this home.
Original Mortgage
$360,000
Interest Rate
4.8%
Mortgage Type
New Conventional
Purchase Details
Closed on
Nov 11, 2009
Sold by
Seeley Nelson
Bought by
Seeley Cheridah
Purchase Details
Closed on
Aug 23, 2002
Sold by
Hernandez Norbert and Hernandez Lori L
Bought by
Seeley Nelson
Home Financials for this Owner
Home Financials are based on the most recent Mortgage that was taken out on this home.
Original Mortgage
$226,400
Interest Rate
6.87%
Create a Home Valuation Report for This Property
The Home Valuation Report is an in-depth analysis detailing your home's value as well as a comparison with similar homes in the area
Home Values in the Area
Average Home Value in this Area
Purchase History
| Date | Buyer | Sale Price | Title Company |
|---|---|---|---|
| Seeley/Lignier Family Trust | -- | None Listed On Document | |
| Seeley Cheridah J | -- | Bnt Title Company Of Califor | |
| Seeley Cheridah | -- | Accommodation | |
| Seeley Nelson | $283,000 | Chicago Title Co |
Source: Public Records
Mortgage History
| Date | Status | Borrower | Loan Amount |
|---|---|---|---|
| Previous Owner | Seeley Cheridah J | $360,000 | |
| Previous Owner | Seeley Nelson | $226,400 | |
| Closed | Seeley Nelson | $56,600 |
Source: Public Records
Tax History
| Year | Tax Paid | Tax Assessment Tax Assessment Total Assessment is a certain percentage of the fair market value that is determined by local assessors to be the total taxable value of land and additions on the property. | Land | Improvement |
|---|---|---|---|---|
| 2025 | $5,680 | $409,857 | $255,910 | $153,947 |
| 2024 | $5,680 | $401,822 | $250,893 | $150,929 |
| 2023 | $5,374 | $393,944 | $245,974 | $147,970 |
| 2022 | $5,281 | $386,220 | $241,151 | $145,069 |
| 2021 | $5,178 | $378,648 | $236,423 | $142,225 |
| 2020 | $5,120 | $374,766 | $233,999 | $140,767 |
| 2019 | $4,987 | $367,418 | $229,411 | $138,007 |
| 2018 | $5,226 | $360,214 | $224,913 | $135,301 |
| 2016 | $4,790 | $346,229 | $216,180 | $130,049 |
| 2015 | $4,743 | $341,029 | $212,933 | $128,096 |
| 2014 | $4,671 | $334,349 | $208,762 | $125,587 |
Source: Public Records
Map
Nearby Homes
- 27728 Buckskin Dr
- 29114 Rangewood Rd
- 27864 Wakefield Rd
- 27643 Quincy St
- 29632 Teasedale Place
- 27604 Firebrand Dr
- 28327 Gibraltar Ln
- 29862 Muledeer Ln
- 27745 Desert Place
- 27712 Lonestar Place
- 27922 Bridlewood Dr
- 29960 Saguaro St
- 28414 Old Springs Rd
- 28504 Wildflower Terrace
- 28507 Wildflower Terrace
- 28511 Wildflower Terrace
- 30160 Holmby Ct
- 28704 Orange Park Dr
- 28710 Orange Park Dr
- 28716 Orange Park Dr
- 29223 Rangewood Rd
- 29215 Rangewood Rd
- 29218 Quincy St
- 29209 Rangewood Rd
- 29227 Rangewood Rd
- 29212 Quincy St
- 29222 Quincy St
- 29208 Quincy St
- 27740 Saddleridge Way
- 29228 Quincy St
- 29203 Rangewood Rd
- 29202 Quincy St
- 27757 Buckskin Dr
- 29165 Rangewood Rd
- 27734 Saddleridge Way
- 29190 Quincy St
- 27755 Buckskin Dr
- 29161 Rangewood Rd
- 29215 Quincy St
- 29186 Quincy St
Your Personal Tour Guide
Ask me questions while you tour the home.