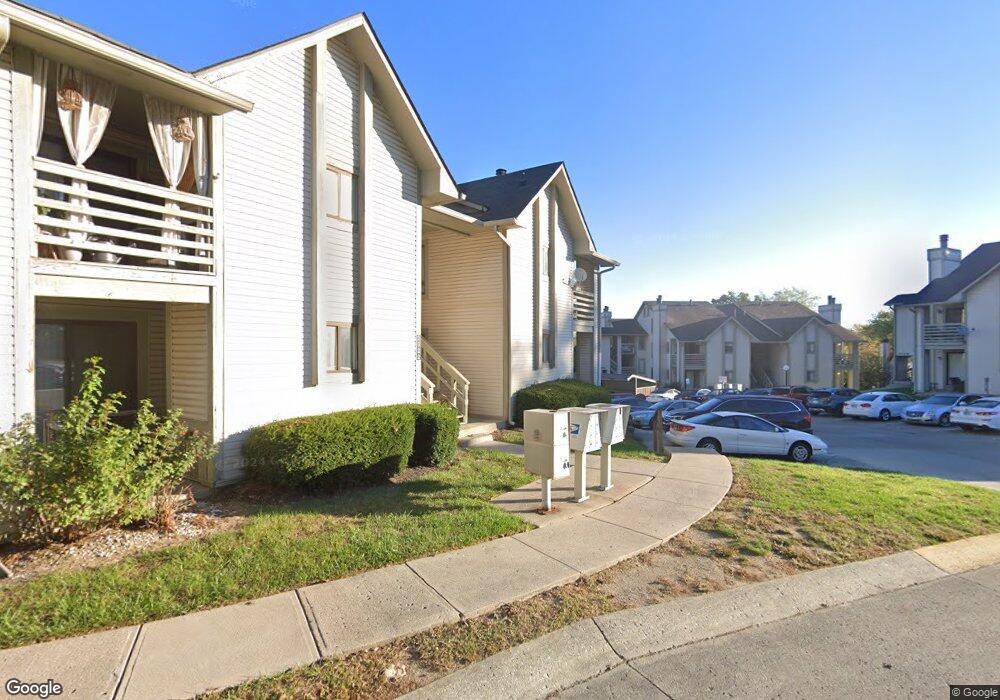
2922 Eagles Crest Cir Unit 2922A Indianapolis, IN 46214
Key Meadows NeighborhoodEstimated Value: $74,000 - $133,000
1
Bed
1
Bath
767
Sq Ft
$132/Sq Ft
Est. Value
About This Home
This home is located at 2922 Eagles Crest Cir Unit 2922A, Indianapolis, IN 46214 and is currently estimated at $101,091, approximately $131 per square foot. 2922 Eagles Crest Cir Unit 2922A is a home located in Marion County with nearby schools including North Wayne Elementary School, Chapel Hill 7th & 8th Grade Center, and Ben Davis Ninth Grade Center.
Ownership History
Date
Name
Owned For
Owner Type
Purchase Details
Closed on
Sep 1, 2021
Sold by
Jordan Vicki L
Bought by
Huskey Emily and Huskey Kyle
Current Estimated Value
Home Financials for this Owner
Home Financials are based on the most recent Mortgage that was taken out on this home.
Original Mortgage
$42,000
Outstanding Balance
$38,075
Interest Rate
2.7%
Mortgage Type
New Conventional
Estimated Equity
$63,016
Purchase Details
Closed on
Mar 15, 2013
Sold by
Wise Carla
Bought by
Jordan Vicki L
Purchase Details
Closed on
May 24, 2010
Sold by
Federal National Mortgage Association
Bought by
Wise Carla
Purchase Details
Closed on
Jan 6, 2010
Sold by
Forum Credit Union
Bought by
Federal National Mortgage Association
Purchase Details
Closed on
Nov 19, 2009
Sold by
Wallace Loyd W and Flanagan Denise A
Bought by
Forum Credit Union and Forum Financial Group Inc
Create a Home Valuation Report for This Property
The Home Valuation Report is an in-depth analysis detailing your home's value as well as a comparison with similar homes in the area
Home Values in the Area
Average Home Value in this Area
Purchase History
| Date | Buyer | Sale Price | Title Company |
|---|---|---|---|
| Huskey Emily | $56,000 | Chicago Title | |
| Jordan Vicki L | $25,000 | -- | |
| Wise Carla | -- | None Available | |
| Federal National Mortgage Association | -- | None Available | |
| Forum Credit Union | $40,109 | None Available |
Source: Public Records
Mortgage History
| Date | Status | Borrower | Loan Amount |
|---|---|---|---|
| Open | Huskey Emily | $42,000 |
Source: Public Records
Tax History Compared to Growth
Tax History
| Year | Tax Paid | Tax Assessment Tax Assessment Total Assessment is a certain percentage of the fair market value that is determined by local assessors to be the total taxable value of land and additions on the property. | Land | Improvement |
|---|---|---|---|---|
| 2024 | $1,489 | $61,200 | $9,600 | $51,600 |
| 2023 | $1,489 | $61,200 | $9,600 | $51,600 |
| 2022 | $1,545 | $58,200 | $9,600 | $48,600 |
| 2021 | $575 | $44,400 | $9,600 | $34,800 |
| 2020 | $576 | $44,400 | $9,600 | $34,800 |
| 2019 | $521 | $40,000 | $9,600 | $30,400 |
| 2018 | $419 | $34,700 | $9,600 | $25,100 |
| 2017 | $410 | $33,800 | $9,600 | $24,200 |
| 2016 | $424 | $35,000 | $9,600 | $25,400 |
| 2014 | $324 | $34,100 | $9,600 | $24,500 |
| 2013 | $771 | $33,300 | $9,600 | $23,700 |
Source: Public Records
Map
Nearby Homes
- 2807 Saddle Barn Dr E
- 3213 Oceanline Dr E
- 3104 Valley Farms Rd
- 3266 Oceanline East Dr
- 3276 Eddy Ct
- 8024 Sunfield Ct Unit 5-B
- 7529 Oceanline Dr
- 3131 Stillmeadow Dr
- 7962 Valley Farms Ct
- 8001 Valley Farms Ln
- 2463 Kettering Way
- 7848 Inishmore Way
- 3429 Maritime Dr
- 3335 Oceanline Dr
- 3411 Oceanline Dr
- 8317 Pine Branch Ln
- 3160 Dandy Trail
- 8333 Pine Branch Ln
- 2249 Rolling Oak Dr
- 7906 Windham Lake Way Unit 11
- 2922 Eagles Crest Cir Unit B
- 2922 Eagles Crest Cir
- 2922 Eagles Crest Cir
- 2922 Eagles Crest Cir
- 2922 Eagles Crest Cir Unit C
- 2922 Eagles Crest Cir Unit A
- 2922 Eagles Crest Cir Unit 6- 2922A
- 2932 Eagles Crest Cir
- 2932 Eagles Crest Cir
- 2932 Eagles Crest Cir
- 2932 Eagles Crest Cir Unit 2932A
- 2932 Eagles Crest Cir Unit B
- 2932 Eagles Crest Cir Unit C
- 2932 Eagles Crest Cir Unit 6
- 2922 Eagles Crest-B Creek
- 2922 Eagles Crest-D Creek
- 2922 Eagles Crest-C Creek
- 2878 Eagles Crest Cir Unit A
- 2878 Eagles Crest Cir Unit 2878B
- 2878 Eagles Crest Cir