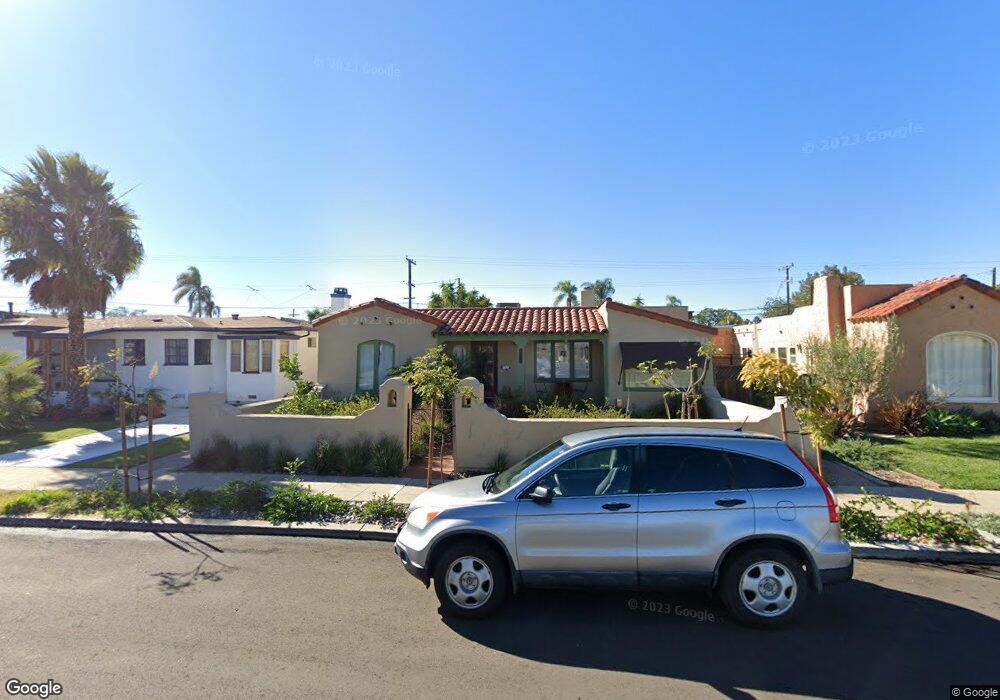
2922 Felton St San Diego, CA 92104
North Park NeighborhoodEstimated Value: $1,383,000 - $1,561,000
4
Beds
2
Baths
1,667
Sq Ft
$884/Sq Ft
Est. Value
About This Home
This home is located at 2922 Felton St, San Diego, CA 92104 and is currently estimated at $1,474,214, approximately $884 per square foot. 2922 Felton St is a home located in San Diego County with nearby schools including McKinley Elementary School, Roosevelt International Middle School, and Mcgill School Of Success.
Ownership History
Date
Name
Owned For
Owner Type
Purchase Details
Closed on
May 10, 2007
Sold by
Christensen David A and Christensen Silvia E
Bought by
Stoll Michael N H and Stoll Heather M L
Current Estimated Value
Home Financials for this Owner
Home Financials are based on the most recent Mortgage that was taken out on this home.
Original Mortgage
$596,800
Outstanding Balance
$362,420
Interest Rate
6.14%
Mortgage Type
Purchase Money Mortgage
Estimated Equity
$1,111,794
Purchase Details
Closed on
Sep 29, 2003
Sold by
Hagerman Carol and Holden Barbara L
Bought by
Christensen David A and Lopez Silvia E
Home Financials for this Owner
Home Financials are based on the most recent Mortgage that was taken out on this home.
Original Mortgage
$383,200
Interest Rate
5.75%
Mortgage Type
Purchase Money Mortgage
Purchase Details
Closed on
Jun 10, 2002
Sold by
Holden Barbara L
Bought by
Holden Barbara L
Create a Home Valuation Report for This Property
The Home Valuation Report is an in-depth analysis detailing your home's value as well as a comparison with similar homes in the area
Home Values in the Area
Average Home Value in this Area
Purchase History
| Date | Buyer | Sale Price | Title Company |
|---|---|---|---|
| Stoll Michael N H | $746,000 | Fidelity National Title | |
| Christensen David A | $479,000 | United Title Company | |
| Holden Barbara L | -- | -- |
Source: Public Records
Mortgage History
| Date | Status | Borrower | Loan Amount |
|---|---|---|---|
| Open | Stoll Michael N H | $596,800 | |
| Previous Owner | Christensen David A | $383,200 | |
| Closed | Christensen David A | $47,900 |
Source: Public Records
Tax History Compared to Growth
Tax History
| Year | Tax Paid | Tax Assessment Tax Assessment Total Assessment is a certain percentage of the fair market value that is determined by local assessors to be the total taxable value of land and additions on the property. | Land | Improvement |
|---|---|---|---|---|
| 2025 | $12,014 | $999,414 | $625,939 | $373,475 |
| 2024 | $12,014 | $979,818 | $613,666 | $366,152 |
| 2023 | $11,747 | $960,607 | $601,634 | $358,973 |
| 2022 | $11,431 | $941,773 | $589,838 | $351,935 |
| 2021 | $11,350 | $923,308 | $578,273 | $345,035 |
| 2020 | $10,734 | $875,000 | $492,000 | $383,000 |
| 2019 | $10,444 | $850,000 | $478,000 | $372,000 |
| 2018 | $9,959 | $850,000 | $478,000 | $372,000 |
| 2017 | $8,746 | $750,000 | $422,000 | $328,000 |
| 2016 | $8,778 | $750,000 | $422,000 | $328,000 |
| 2015 | $8,193 | $700,000 | $394,000 | $306,000 |
| 2014 | $7,929 | $675,000 | $380,000 | $295,000 |
Source: Public Records
Map
Nearby Homes
- 2735-37 Teresita St
- 2929 32nd St
- 3483 Olive St Unit 85
- 3129 Redwood St
- 3078 Quince St
- 2438 33rd St
- 2685 Montclair St
- 3005 Vancouver Ave
- 2661 Montclair St
- 2429 32nd St
- 3322 Nile St
- 3388 Bancroft St
- 2609 Montclair St Unit 11
- 3606 Maple St Unit 12
- 2475 Capitan Ave
- 3005 Olive St
- 3143-47 30th St
- 2748 30th St
- 0 35th St
- 3365-69 Grim Ave