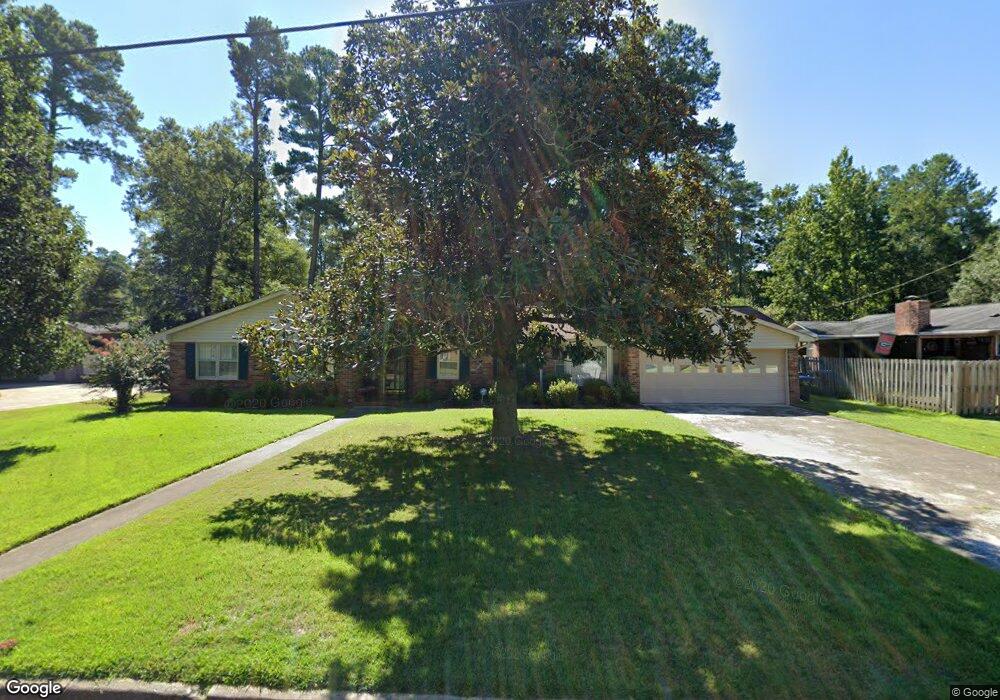
2922 Kipling Dr Augusta, GA 30909
West Augusta NeighborhoodEstimated Value: $279,000 - $330,000
4
Beds
3
Baths
2,060
Sq Ft
$148/Sq Ft
Est. Value
About This Home
This home is located at 2922 Kipling Dr, Augusta, GA 30909 and is currently estimated at $305,086, approximately $148 per square foot. 2922 Kipling Dr is a home located in Richmond County with nearby schools including Tutt Middle School, Johnson Magnet, and Westside High School.
Ownership History
Date
Name
Owned For
Owner Type
Purchase Details
Closed on
Feb 22, 2008
Sold by
Bowman Kathryn R and Bowman Gregory M
Bought by
Knight James P and Knight Helen H
Current Estimated Value
Home Financials for this Owner
Home Financials are based on the most recent Mortgage that was taken out on this home.
Original Mortgage
$147,000
Outstanding Balance
$89,446
Interest Rate
5.65%
Mortgage Type
Purchase Money Mortgage
Estimated Equity
$215,640
Purchase Details
Closed on
Oct 31, 1997
Sold by
Emmett Kathryn R and Bowman Kathryn R
Bought by
Bowman Kathryn R and Bowman Gregory M
Home Financials for this Owner
Home Financials are based on the most recent Mortgage that was taken out on this home.
Original Mortgage
$116,510
Interest Rate
7.31%
Purchase Details
Closed on
Feb 20, 1997
Sold by
Bowman Kathryn R
Bought by
Bowman Gregory M
Purchase Details
Closed on
Jul 18, 1994
Sold by
Dale Margaret Sarah
Bought by
Emmett Kathryn R
Purchase Details
Closed on
Dec 16, 1992
Sold by
Padilla Betty G By
Bought by
Dale Margaret Sarah
Purchase Details
Closed on
Aug 1, 1973
Create a Home Valuation Report for This Property
The Home Valuation Report is an in-depth analysis detailing your home's value as well as a comparison with similar homes in the area
Home Values in the Area
Average Home Value in this Area
Purchase History
| Date | Buyer | Sale Price | Title Company |
|---|---|---|---|
| Knight James P | $187,000 | None Available | |
| Bowman Kathryn R | -- | -- | |
| Bowman Gregory M | -- | -- | |
| Emmett Kathryn R | $108,800 | -- | |
| Dale Margaret Sarah | $89,900 | -- | |
| -- | $38,600 | -- |
Source: Public Records
Mortgage History
| Date | Status | Borrower | Loan Amount |
|---|---|---|---|
| Open | Knight James P | $147,000 | |
| Previous Owner | Bowman Kathryn R | $116,510 |
Source: Public Records
Tax History
| Year | Tax Paid | Tax Assessment Tax Assessment Total Assessment is a certain percentage of the fair market value that is determined by local assessors to be the total taxable value of land and additions on the property. | Land | Improvement |
|---|---|---|---|---|
| 2025 | $1,147 | $88,236 | $14,000 | $74,236 |
| 2024 | $1,147 | $96,600 | $14,000 | $82,600 |
| 2023 | $1,173 | $90,256 | $14,000 | $76,256 |
| 2022 | $1,238 | $86,322 | $14,000 | $72,322 |
| 2021 | $1,145 | $69,520 | $14,000 | $55,520 |
| 2020 | $1,072 | $62,676 | $14,000 | $48,676 |
| 2019 | $1,120 | $62,676 | $14,000 | $48,676 |
| 2018 | $1,126 | $62,676 | $14,000 | $48,676 |
| 2017 | $1,088 | $62,676 | $14,000 | $48,676 |
| 2016 | $1,089 | $62,676 | $14,000 | $48,676 |
| 2015 | $1,089 | $62,676 | $14,000 | $48,676 |
| 2014 | $1,088 | $62,676 | $14,000 | $48,676 |
Source: Public Records
Map
Nearby Homes
- 2908 Stratford Dr
- 2507 Pinebluff Ct
- 505 Stratford Dr
- 427 Aumond Rd
- 441 Aumond Rd
- 2902 Sussex Rd
- 2703 Oakbluff Ct
- 434 Aumond Rd
- 2918 Arrowhead Dr
- 3120 Edinburgh Dr
- 3121 Ramsgate Rd
- 3118 Exeter Rd
- 3123 Exeter Rd
- 3082 Westwood Rd
- 3084 Westwood Rd
- 3086 Westwood Rd
- 3129 Edinburgh Dr
- 3125 Exeter Rd
- 603 Trafalgar Ln
- 3144 Edinburgh Dr
- 2924 Kipling Dr
- 2920 Kipling Dr
- 2923 Sussex Rd
- 2921 Sussex Rd
- 2925 Sussex Rd
- 2921 Kipling Dr
- 2918 Kipling Dr
- 2923 Kipling Dr
- 2919 Kipling Dr
- 2919 Sussex Rd
- 2917 Kipling Dr
- 2931 Kipling Dr
- 2929 Kipling Dr
- 2916 Kipling Dr
- 2925 Kipling Dr
- 2927 Sussex Rd
- 2917 Sussex Rd
- 2926 Sussex Rd
- 2927 Kipling Dr
- 2924 Sussex Rd
Your Personal Tour Guide
Ask me questions while you tour the home.