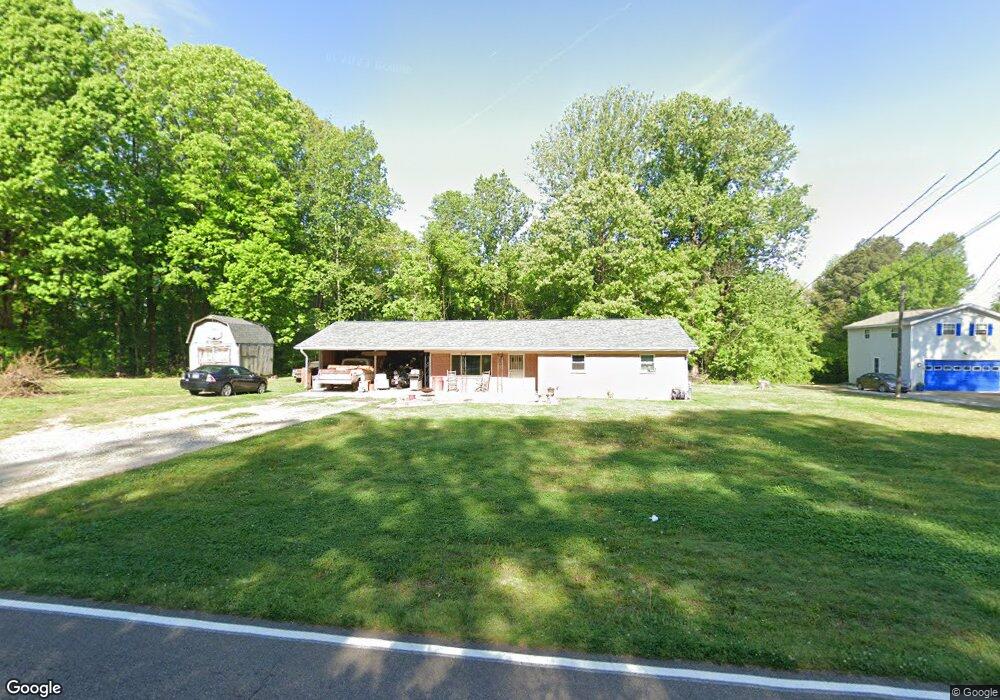
2923 Beaver Rd Munford, TN 38058
Estimated Value: $172,000 - $273,000
3
Beds
2
Baths
1,538
Sq Ft
$157/Sq Ft
Est. Value
About This Home
This home is located at 2923 Beaver Rd, Munford, TN 38058 and is currently estimated at $241,001, approximately $156 per square foot. 2923 Beaver Rd is a home located in Tipton County with nearby schools including Munford Elementary School, Munford Middle School, and Munford High School.
Ownership History
Date
Name
Owned For
Owner Type
Purchase Details
Closed on
May 18, 2016
Sold by
Adamson Ashleigh
Bought by
Lively David W and Lively Karen
Current Estimated Value
Home Financials for this Owner
Home Financials are based on the most recent Mortgage that was taken out on this home.
Original Mortgage
$98,188
Outstanding Balance
$78,894
Interest Rate
3.95%
Mortgage Type
FHA
Estimated Equity
$162,107
Purchase Details
Closed on
Jun 22, 2010
Sold by
Rickels Charles E
Bought by
Adamson Ashleigh
Home Financials for this Owner
Home Financials are based on the most recent Mortgage that was taken out on this home.
Original Mortgage
$10,000
Interest Rate
4.77%
Purchase Details
Closed on
Oct 19, 1989
Bought by
Rickels Charles E and Rickels Alice H
Purchase Details
Closed on
Jan 1, 1976
Bought by
Martin Arnold L and Martin Martha C
Purchase Details
Closed on
Jan 1, 1971
Purchase Details
Closed on
Feb 10, 1970
Create a Home Valuation Report for This Property
The Home Valuation Report is an in-depth analysis detailing your home's value as well as a comparison with similar homes in the area
Home Values in the Area
Average Home Value in this Area
Purchase History
| Date | Buyer | Sale Price | Title Company |
|---|---|---|---|
| Lively David W | $100,000 | -- | |
| Adamson Ashleigh | $75,000 | -- | |
| Rickels Charles E | $55,200 | -- | |
| Martin Arnold L | $35,900 | -- | |
| -- | $1,800 | -- | |
| -- | -- | -- |
Source: Public Records
Mortgage History
| Date | Status | Borrower | Loan Amount |
|---|---|---|---|
| Open | Lively David W | $98,188 | |
| Previous Owner | Not Available | $10,000 |
Source: Public Records
Tax History Compared to Growth
Tax History
| Year | Tax Paid | Tax Assessment Tax Assessment Total Assessment is a certain percentage of the fair market value that is determined by local assessors to be the total taxable value of land and additions on the property. | Land | Improvement |
|---|---|---|---|---|
| 2024 | $789 | $51,875 | $9,250 | $42,625 |
| 2023 | $789 | $51,875 | $9,250 | $42,625 |
| 2022 | $743 | $36,400 | $6,800 | $29,600 |
| 2021 | $743 | $36,400 | $6,800 | $29,600 |
| 2020 | $742 | $36,400 | $6,800 | $29,600 |
| 2019 | $557 | $23,025 | $5,250 | $17,775 |
| 2018 | $557 | $23,025 | $5,250 | $17,775 |
| 2017 | $557 | $23,025 | $5,250 | $17,775 |
| 2016 | $557 | $23,025 | $5,250 | $17,775 |
| 2015 | $556 | $23,025 | $5,250 | $17,775 |
| 2014 | $556 | $23,025 | $0 | $0 |
Source: Public Records
Map
Nearby Homes
- 25 Alex Dr
- 730 Melanie Ln
- 61 Chelsia Ln
- 1503 Beaver Rd
- 575 Egypt Rd
- 864 Akins Store Rd
- 50 Robin St
- 157 Jimmie Lee Cove
- 120 Jimmie Lee Cove
- 0 Rolling Oaks Dr
- 71 G Lafont Cir
- 492 Fite Rd
- 474 Fite Rd
- 0000 Bowers Rd
- 118 Robert L Ellis Dr
- 173 Littleton Way
- 204 Fite Rd
- 1587 Akins Rd
- LOT 0002 Marshall Rd
- 372 Beaver Rd