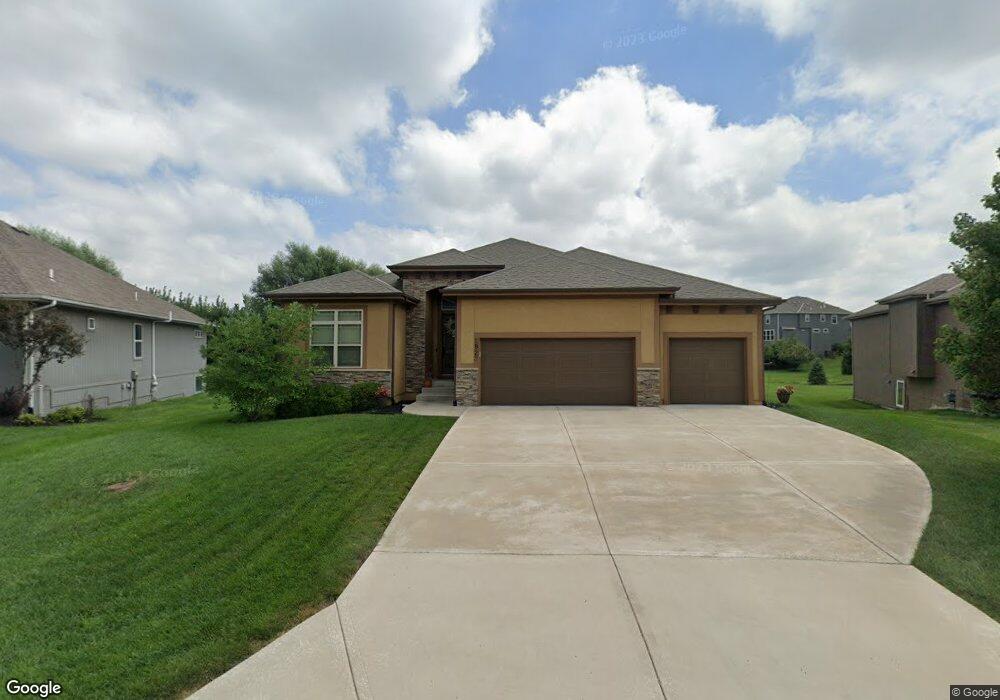
2923 W 155th Terrace Overland Park, KS 66224
Estimated Value: $716,000 - $784,000
4
Beds
4
Baths
2,111
Sq Ft
$355/Sq Ft
Est. Value
About This Home
This home is located at 2923 W 155th Terrace, Overland Park, KS 66224 and is currently estimated at $749,190, approximately $354 per square foot. 2923 W 155th Terrace is a home located in Johnson County with nearby schools including Sunrise Point Elementary School, Prairie Star Middle School, and Blue Valley High School.
Ownership History
Date
Name
Owned For
Owner Type
Purchase Details
Closed on
Sep 2, 2015
Sold by
Rw Investments Llc
Bought by
Jones Nicklas and Jones Samantha
Current Estimated Value
Home Financials for this Owner
Home Financials are based on the most recent Mortgage that was taken out on this home.
Original Mortgage
$401,484
Outstanding Balance
$315,447
Interest Rate
3.92%
Mortgage Type
New Conventional
Estimated Equity
$433,743
Purchase Details
Closed on
Dec 9, 2010
Sold by
Duggan Homes Inc
Bought by
North American Savings Bank F S B
Purchase Details
Closed on
May 23, 2007
Sold by
Be05 Investments Llc
Bought by
Duggan Homes Inc
Home Financials for this Owner
Home Financials are based on the most recent Mortgage that was taken out on this home.
Original Mortgage
$311,960
Interest Rate
6.16%
Mortgage Type
Construction
Purchase Details
Closed on
Dec 6, 2006
Sold by
Duggan Homes Inc
Bought by
Be05 Inestments Llc
Purchase Details
Closed on
Sep 22, 2005
Sold by
Duggan Homes Inc
Bought by
Beo5 Investments Llc
Create a Home Valuation Report for This Property
The Home Valuation Report is an in-depth analysis detailing your home's value as well as a comparison with similar homes in the area
Home Values in the Area
Average Home Value in this Area
Purchase History
| Date | Buyer | Sale Price | Title Company |
|---|---|---|---|
| Jones Nicklas | -- | Midwest Title Co Inc | |
| North American Savings Bank F S B | -- | None Available | |
| Duggan Homes Inc | -- | Chicago Title Ins Co | |
| Be05 Inestments Llc | -- | None Available | |
| Beo5 Investments Llc | -- | None Available |
Source: Public Records
Mortgage History
| Date | Status | Borrower | Loan Amount |
|---|---|---|---|
| Open | Jones Nicklas | $401,484 | |
| Previous Owner | Duggan Homes Inc | $311,960 |
Source: Public Records
Tax History Compared to Growth
Tax History
| Year | Tax Paid | Tax Assessment Tax Assessment Total Assessment is a certain percentage of the fair market value that is determined by local assessors to be the total taxable value of land and additions on the property. | Land | Improvement |
|---|---|---|---|---|
| 2024 | $7,775 | $75,486 | $12,727 | $62,759 |
| 2023 | $6,810 | $65,262 | $12,727 | $52,535 |
| 2022 | $6,293 | $59,248 | $12,727 | $46,521 |
| 2021 | $6,331 | $56,649 | $11,563 | $45,086 |
| 2020 | $6,229 | $55,350 | $10,057 | $45,293 |
| 2019 | $6,564 | $57,086 | $8,739 | $48,347 |
| 2018 | $3,769 | $54,890 | $8,739 | $46,151 |
| 2017 | $5,938 | $49,726 | $8,739 | $40,987 |
| 2016 | $5,808 | $48,601 | $8,739 | $39,862 |
| 2015 | $1,099 | $9,119 | $9,119 | $0 |
| 2013 | -- | $9,119 | $9,119 | $0 |
Source: Public Records
Map
Nearby Homes
- 18465 Windsor St
- 3500 W 153rd St
- 18464 Windsor St
- 3713 W 155th St
- 18452 Pawnee Ln
- 18456 Pawnee Ln
- 18460 Pawnee Ln
- 18505 Pawnee Ln
- 18509 Pawnee Ln
- 15801 Canterbury St
- 15141 Windsor Cir
- 15709 Howe St
- 18605 Reinhardt St
- 18612 Reinhardt St
- 3609 Iron Horse Ct
- 15812 Howe St
- The Carmel Plan at The Hills of Leawood - Hills of Leawood Estates
- The Grand Laguna Plan at The Hills of Leawood - Hills of Leawood Estates
- The Grand H4L Plan at The Hills of Leawood - Hills of Leawood Estates
- 15825 Howe St
- 2927 W 155th Terrace
- 2919 W 155th Terrace
- 3003 W 155th Terrace
- 2915 W 155th Terrace
- 2918 W 155th Terrace
- 15504 Chadwick St
- 15500 Chadwick St
- 3007 W 155th Terrace
- 2911 W 155th Terrace
- 2914 W 155th Terrace
- 3104 W 156th St
- 2910 W 155th Terrace
- 3103 W 155th Terrace
- 15509 Canterbury St
- 15505 Cantebury St
- 15505 Canterbury St
- 15508 Chadwick St
- 3108 W 156th St
- 3107 W 155th Terrace
- 3200 W 156th St