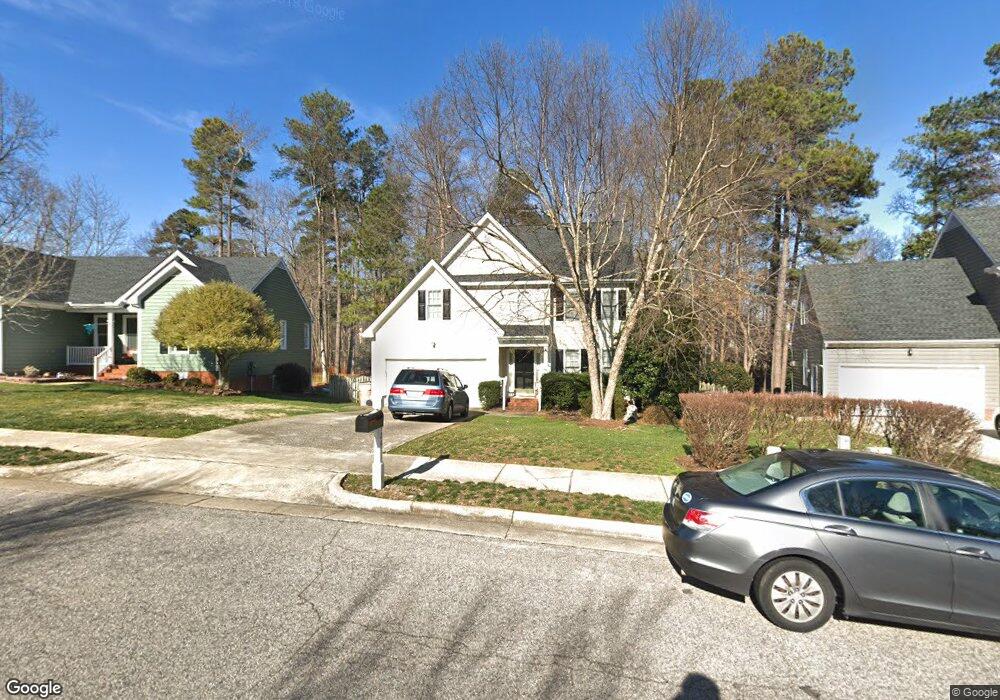
2924 Dahlgreen Rd Raleigh, NC 27615
Durant NeighborhoodEstimated Value: $470,437 - $504,000
3
Beds
3
Baths
1,944
Sq Ft
$253/Sq Ft
Est. Value
About This Home
This home is located at 2924 Dahlgreen Rd, Raleigh, NC 27615 and is currently estimated at $491,859, approximately $253 per square foot. 2924 Dahlgreen Rd is a home located in Wake County with nearby schools including Durant Road Elementary, Durant Road Middle, and Millbrook High School.
Ownership History
Date
Name
Owned For
Owner Type
Purchase Details
Closed on
Sep 7, 2007
Sold by
Watson Steven E and Kathleen Watson Q
Bought by
Perrone Eric and Perrone Maria S
Current Estimated Value
Home Financials for this Owner
Home Financials are based on the most recent Mortgage that was taken out on this home.
Original Mortgage
$207,200
Outstanding Balance
$130,105
Interest Rate
6.41%
Mortgage Type
Purchase Money Mortgage
Estimated Equity
$361,754
Purchase Details
Closed on
Jan 28, 1999
Sold by
Sweet Marc E and Sweet Carol L
Bought by
Watson Steven E and Kathleen Watson Q
Home Financials for this Owner
Home Financials are based on the most recent Mortgage that was taken out on this home.
Original Mortgage
$180,400
Interest Rate
6.72%
Purchase Details
Closed on
Dec 2, 1997
Sold by
The Dress Company
Bought by
Sweet Marc E and Sweet Carol L
Home Financials for this Owner
Home Financials are based on the most recent Mortgage that was taken out on this home.
Original Mortgage
$169,100
Interest Rate
7.26%
Create a Home Valuation Report for This Property
The Home Valuation Report is an in-depth analysis detailing your home's value as well as a comparison with similar homes in the area
Home Values in the Area
Average Home Value in this Area
Purchase History
| Date | Buyer | Sale Price | Title Company |
|---|---|---|---|
| Perrone Eric | $259,000 | None Available | |
| Watson Steven E | $190,000 | -- | |
| Sweet Marc E | $178,000 | -- |
Source: Public Records
Mortgage History
| Date | Status | Borrower | Loan Amount |
|---|---|---|---|
| Open | Perrone Eric | $207,200 | |
| Previous Owner | Watson Steven E | $180,400 | |
| Previous Owner | Sweet Marc E | $169,100 |
Source: Public Records
Tax History Compared to Growth
Tax History
| Year | Tax Paid | Tax Assessment Tax Assessment Total Assessment is a certain percentage of the fair market value that is determined by local assessors to be the total taxable value of land and additions on the property. | Land | Improvement |
|---|---|---|---|---|
| 2025 | $3,565 | $406,492 | $100,000 | $306,492 |
| 2024 | $3,550 | $406,492 | $100,000 | $306,492 |
| 2023 | $3,384 | $308,622 | $80,000 | $228,622 |
| 2022 | $3,145 | $308,622 | $80,000 | $228,622 |
| 2021 | $3,023 | $308,622 | $80,000 | $228,622 |
| 2020 | $2,968 | $308,622 | $80,000 | $228,622 |
| 2019 | $2,858 | $244,878 | $73,000 | $171,878 |
| 2018 | $2,696 | $244,878 | $73,000 | $171,878 |
| 2017 | $2,567 | $244,878 | $73,000 | $171,878 |
| 2016 | $2,515 | $244,878 | $73,000 | $171,878 |
| 2015 | $2,523 | $241,737 | $68,000 | $173,737 |
| 2014 | -- | $241,737 | $68,000 | $173,737 |
Source: Public Records
Map
Nearby Homes
- 9512 Anson Grove Ln
- 9505 Crestland Woods Dr
- 9100 Deershire Ct
- 2324 Dahlgreen Rd
- 11001 Louson Place
- 11020 Southwalk Ln
- 11035 Southwalk Ln
- 9101 Jackknife Trail
- 2408 Deanwood Dr
- 8700 Den Ct
- 9012 Walking Stick Trail
- 9013 Tenderfoot Trail
- 3212 Loyal Ln
- 8913 Walking Stick Trail
- 1301 Durlain Dr Unit 103
- 8600 Clivedon Dr
- 1310 Durlain Dr Unit 103
- 2505 Coxindale Dr
- 9509 Greenfield Dr
- 8909 Creekstone Ct Unit 11
- 2920 Dahlgreen Rd
- 2928 Dahlgreen Rd
- 2916 Dahlgreen Rd
- 2932 Dahlgreen Rd
- 9408 Cub Trail
- 9406 Cub Trail
- 2925 Dahlgreen Rd
- 2917 Dahlgreen Rd
- 2912 Dahlgreen Rd
- 2933 Dahlgreen Rd
- 2612 Crofton Springs Dr
- 2616 Crofton Springs Dr
- 2913 Dahlgreen Rd
- 2608 Crofton Springs Dr
- 9308 Cub Trail
- 2620 Crofton Springs Dr
- 2908 Dahlgreen Rd
- 3000 Dahlgreen Rd
- 2604 Crofton Springs Dr
- 2909 Dahlgreen Rd