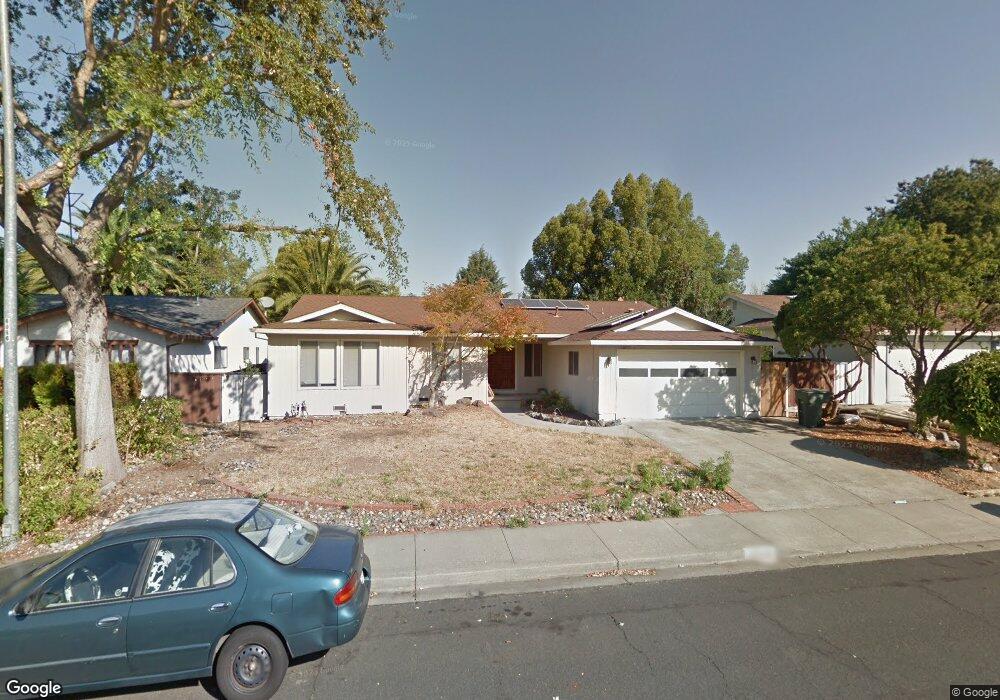
2925 Springvale Way Concord, CA 94518
Vista Diablo/Wilshire Estates NeighborhoodEstimated Value: $881,695 - $1,009,000
4
Beds
2
Baths
1,701
Sq Ft
$544/Sq Ft
Est. Value
About This Home
This home is located at 2925 Springvale Way, Concord, CA 94518 and is currently estimated at $925,174, approximately $543 per square foot. 2925 Springvale Way is a home located in Contra Costa County with nearby schools including Woodside Elementary School, Oak Grove Middle School, and Ygnacio Valley High School.
Ownership History
Date
Name
Owned For
Owner Type
Purchase Details
Closed on
Jun 13, 2012
Sold by
Lind Monica A
Bought by
Lind Monica A and Lind John W
Current Estimated Value
Purchase Details
Closed on
Sep 29, 2007
Sold by
Buster Matthew A and Lind Monica A
Bought by
Lind Monica A
Purchase Details
Closed on
Dec 15, 2003
Sold by
Hong Jun Pyo and Hong U
Bought by
Buster Matthew A and Lind Monica A
Home Financials for this Owner
Home Financials are based on the most recent Mortgage that was taken out on this home.
Original Mortgage
$322,700
Interest Rate
5.97%
Mortgage Type
Purchase Money Mortgage
Purchase Details
Closed on
Dec 14, 1993
Sold by
Delprete Louis and Delprete Frances
Bought by
Hong Jun Pyo and Hong U
Home Financials for this Owner
Home Financials are based on the most recent Mortgage that was taken out on this home.
Original Mortgage
$201,600
Interest Rate
7.09%
Mortgage Type
Purchase Money Mortgage
Create a Home Valuation Report for This Property
The Home Valuation Report is an in-depth analysis detailing your home's value as well as a comparison with similar homes in the area
Home Values in the Area
Average Home Value in this Area
Purchase History
| Date | Buyer | Sale Price | Title Company |
|---|---|---|---|
| Lind Monica A | -- | None Available | |
| Lind Monica A | $127,000 | None Available | |
| Buster Matthew A | $475,000 | Old Republic Title | |
| Hong Jun Pyo | $224,000 | Northwestern Title Co |
Source: Public Records
Mortgage History
| Date | Status | Borrower | Loan Amount |
|---|---|---|---|
| Previous Owner | Buster Matthew A | $322,700 | |
| Previous Owner | Hong Jun Pyo | $201,600 |
Source: Public Records
Tax History
| Year | Tax Paid | Tax Assessment Tax Assessment Total Assessment is a certain percentage of the fair market value that is determined by local assessors to be the total taxable value of land and additions on the property. | Land | Improvement |
|---|---|---|---|---|
| 2025 | $8,052 | $645,021 | $329,929 | $315,092 |
| 2024 | $7,697 | $632,374 | $323,460 | $308,914 |
| 2023 | $7,697 | $619,975 | $317,118 | $302,857 |
| 2022 | $7,594 | $607,819 | $310,900 | $296,919 |
| 2021 | $7,407 | $595,902 | $304,804 | $291,098 |
| 2019 | $7,264 | $578,229 | $295,764 | $282,465 |
| 2018 | $6,989 | $566,892 | $289,965 | $276,927 |
| 2017 | $6,756 | $555,778 | $284,280 | $271,498 |
| 2016 | $6,573 | $544,881 | $278,706 | $266,175 |
| 2015 | $6,580 | $536,697 | $274,520 | $262,177 |
| 2014 | $5,388 | $430,000 | $219,944 | $210,056 |
Source: Public Records
Map
Nearby Homes
- 2745 Minert Rd
- 2190 Charlotte Ave
- 2605 Ryan Rd
- 954 Alla Ave
- 1048 Peppermill Ct
- 20 Terrace Dr
- 3055 Treat Blvd Unit 36
- 91 Terrace Ct
- 3739 Northridge Dr
- 4275 Marietta Ct
- 4252 El Cerrito Rd
- 810 Oak Grove Rd Unit 104
- 177 Rose Marie Ln
- 3181 Santa Maria Dr
- 1941 Woodmoor Ct
- 141 Scenic Dr
- 825 Oak Grove Rd Unit 17
- 825 Oak Grove Rd Unit 62
- 36 Galloway Dr
- 4040 Davenport Ln
- 2915 Springvale Way
- 2935 Springvale Way
- 874 Saint John Cir
- 876 Saint John Cir
- 872 Saint John Cir
- 2930 Springvale Way
- 2945 Springvale Way
- 2905 Springvale Way
- 2940 Springvale Way
- 2920 Springvale Way
- 878 Saint John Cir
- 870 Saint John Cir
- 2950 Springvale Way
- 2910 Springvale Way
- 2955 Springvale Way
- 2925 Ryan Rd
- 880 Saint John Cir
- 2915 Ryan Rd
- 2935 Ryan Rd
- 875 Saint John Cir
Your Personal Tour Guide
Ask me questions while you tour the home.