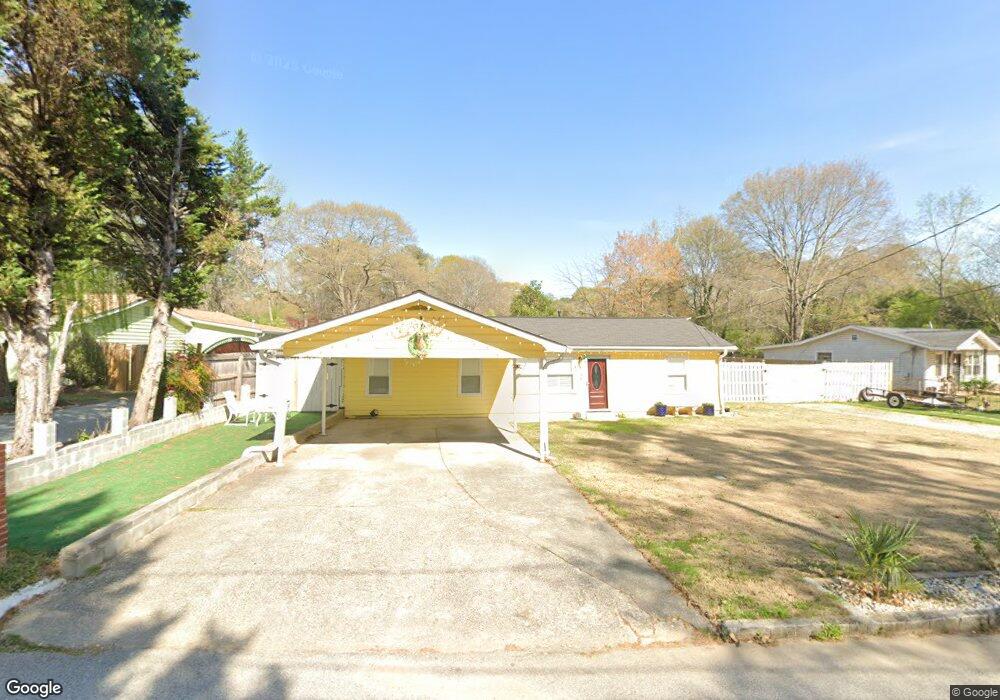
2926 Hall Dr SE Smyrna, GA 30082
Estimated Value: $226,000 - $296,000
2
Beds
1
Bath
1,208
Sq Ft
$215/Sq Ft
Est. Value
About This Home
This home is located at 2926 Hall Dr SE, Smyrna, GA 30082 and is currently estimated at $259,417, approximately $214 per square foot. 2926 Hall Dr SE is a home located in Cobb County with nearby schools including Norton Park Elementary School, Griffin Middle School, and Campbell High School.
Ownership History
Date
Name
Owned For
Owner Type
Purchase Details
Closed on
Jan 31, 2019
Sold by
Dodd L A
Bought by
Rendon Aguilera Asunicon Sanchez and Rendon Carmona Dario
Current Estimated Value
Home Financials for this Owner
Home Financials are based on the most recent Mortgage that was taken out on this home.
Original Mortgage
$115,000
Outstanding Balance
$100,902
Interest Rate
4.5%
Mortgage Type
New Conventional
Estimated Equity
$158,515
Purchase Details
Closed on
Jan 15, 2003
Sold by
Lay John and Lay Linda
Bought by
Dr 2926 Hall
Purchase Details
Closed on
Sep 8, 2000
Sold by
Blackwood Jeremy R
Bought by
Lay John and Lay Linda
Purchase Details
Closed on
Nov 20, 1998
Sold by
Grubb Lynette A
Bought by
Blackwood Jeremy Ray
Home Financials for this Owner
Home Financials are based on the most recent Mortgage that was taken out on this home.
Original Mortgage
$43,650
Interest Rate
6.9%
Mortgage Type
New Conventional
Create a Home Valuation Report for This Property
The Home Valuation Report is an in-depth analysis detailing your home's value as well as a comparison with similar homes in the area
Home Values in the Area
Average Home Value in this Area
Purchase History
| Date | Buyer | Sale Price | Title Company |
|---|---|---|---|
| Rendon Aguilera Asunicon Sanchez | $120,000 | -- | |
| Dr 2926 Hall | -- | -- | |
| Lay John | $70,000 | -- | |
| Blackwood Jeremy Ray | $45,000 | -- |
Source: Public Records
Mortgage History
| Date | Status | Borrower | Loan Amount |
|---|---|---|---|
| Open | Rendon Aguilera Asunicon Sanchez | $115,000 | |
| Previous Owner | Blackwood Jeremy Ray | $43,650 |
Source: Public Records
Tax History Compared to Growth
Tax History
| Year | Tax Paid | Tax Assessment Tax Assessment Total Assessment is a certain percentage of the fair market value that is determined by local assessors to be the total taxable value of land and additions on the property. | Land | Improvement |
|---|---|---|---|---|
| 2025 | $4,193 | $139,180 | $52,000 | $87,180 |
| 2024 | $2,944 | $97,652 | $52,000 | $45,652 |
| 2023 | $2,818 | $93,468 | $30,000 | $63,468 |
| 2022 | $2,401 | $79,104 | $30,000 | $49,104 |
| 2021 | $2,401 | $79,104 | $30,000 | $49,104 |
| 2020 | $1,457 | $48,000 | $15,320 | $32,680 |
| 2019 | $1,736 | $57,208 | $16,000 | $41,208 |
| 2018 | $1,459 | $48,072 | $16,000 | $32,072 |
| 2017 | $1,382 | $48,072 | $16,000 | $32,072 |
| 2016 | $648 | $22,536 | $6,000 | $16,536 |
| 2015 | $610 | $20,700 | $6,000 | $14,700 |
| 2014 | $568 | $19,116 | $0 | $0 |
Source: Public Records
Map
Nearby Homes
- 436 Floyd St SE
- 259 Diane Dr SE
- 260 Diane Dr SE
- 2975 Nursery Rd SE
- 1007 Oaks Pkwy SE
- 2831 Ivanhoe Ln SE
- 2880 Sherwood Rd SE
- 2654 Estelle Ct SE
- 2771 Sherwood Rd SE
- 119 Still Pine Bend
- 571 Norton Cir SE
- 51 Overbrook Dr SE Unit 3
- 85 Smyrna Powder Springs Rd SE
- 358 Nature Brook Walk SE
- 33 Smyrna Powder Springs Rd SE
- 2041 White Cypress Ct
- 2618 Birch St SE
- 2898 Lakemont Dr SW
- 2928 Hall Dr SE
- 2924 Hall Dr SE
- 2922 Hall Dr SE
- 378 Floyd St SE
- 380 Floyd St SE
- 2927 Hall Dr SE
- 2927 Hall Dr SE Unit 7
- 2931 Hall Dr SE Unit 9
- 2931 Hall Dr SE
- 2932 Hall Dr SE
- 2929 Hall Dr SE
- 2925 Hall Dr SE
- 2921 Hall Dr SE
- 382 Floyd St SE
- 376 Floyd St SE
- 2920 Hall Dr SE
- 2934 Hall Dr SE
- 2933 Hall Dr SE
- 2935 Hall Dr SE
- 2919 Hall Dr SE