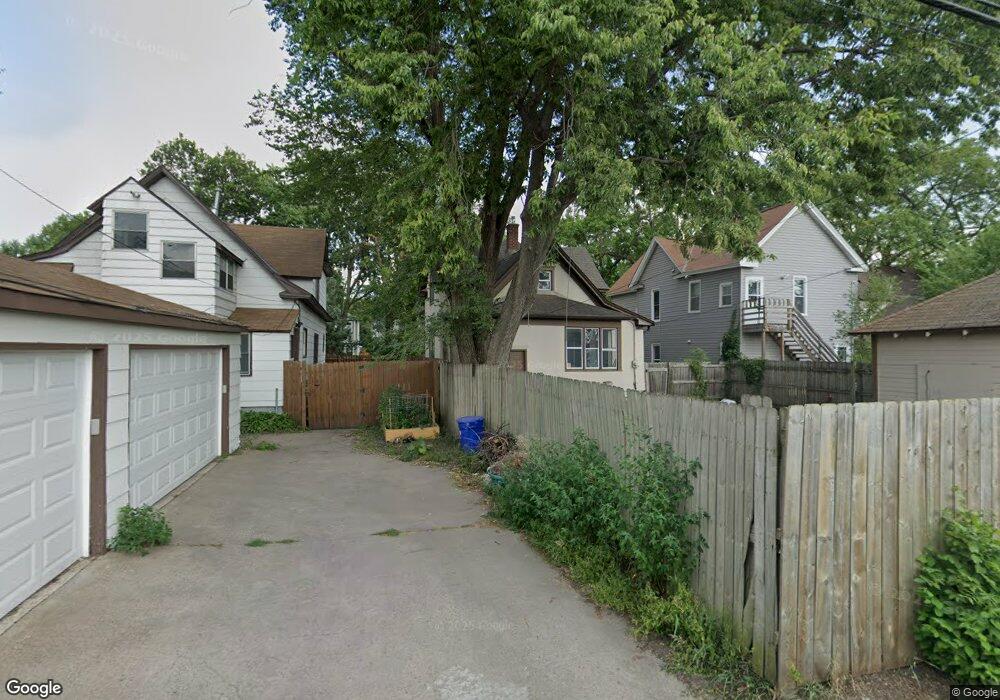
2926 Tyler St NE Minneapolis, MN 55418
Audubon Park NeighborhoodEstimated Value: $376,877 - $430,000
4
Beds
2
Baths
1,484
Sq Ft
$270/Sq Ft
Est. Value
About This Home
This home is located at 2926 Tyler St NE, Minneapolis, MN 55418 and is currently estimated at $400,469, approximately $269 per square foot. 2926 Tyler St NE is a home located in Hennepin County with nearby schools including Waite Park Elementary School, Northeast Middle School, and Thomas Edison High School.
Ownership History
Date
Name
Owned For
Owner Type
Purchase Details
Closed on
Aug 27, 2019
Sold by
Christensen Denniel G and Christensen Rebecca L
Bought by
Dahlin Erin Grace and Grant Michael Thomas
Current Estimated Value
Home Financials for this Owner
Home Financials are based on the most recent Mortgage that was taken out on this home.
Original Mortgage
$273,600
Outstanding Balance
$240,627
Interest Rate
3.8%
Mortgage Type
New Conventional
Estimated Equity
$159,842
Purchase Details
Closed on
May 9, 2011
Sold by
Norby Craig and Norby Jane S
Bought by
Christensen Denniel G and Christensen Rebecca L
Purchase Details
Closed on
Jan 19, 2010
Sold by
Us Bank Na
Bought by
Norby Craig
Purchase Details
Closed on
Oct 13, 2004
Sold by
Tohey Joseph D and Tohey Lisa K
Bought by
Cody Patrick R
Purchase Details
Closed on
Feb 13, 1997
Sold by
Hud
Bought by
Tohey Joseph D
Create a Home Valuation Report for This Property
The Home Valuation Report is an in-depth analysis detailing your home's value as well as a comparison with similar homes in the area
Home Values in the Area
Average Home Value in this Area
Purchase History
| Date | Buyer | Sale Price | Title Company |
|---|---|---|---|
| Dahlin Erin Grace | $288,000 | Watermark Title Agency | |
| Christensen Denniel G | $144,900 | -- | |
| Norby Craig | $37,900 | Edina Realty Title | |
| Norby Craig | $37,900 | -- | |
| Cody Patrick R | $196,000 | -- | |
| Tohey Joseph D | $39,199 | -- |
Source: Public Records
Mortgage History
| Date | Status | Borrower | Loan Amount |
|---|---|---|---|
| Open | Dahlin Erin Grace | $273,600 |
Source: Public Records
Tax History Compared to Growth
Tax History
| Year | Tax Paid | Tax Assessment Tax Assessment Total Assessment is a certain percentage of the fair market value that is determined by local assessors to be the total taxable value of land and additions on the property. | Land | Improvement |
|---|---|---|---|---|
| 2024 | $4,955 | $347,000 | $97,000 | $250,000 |
| 2023 | $4,727 | $366,000 | $97,000 | $269,000 |
| 2022 | $4,135 | $329,000 | $65,000 | $264,000 |
| 2021 | $3,595 | $307,000 | $44,000 | $263,000 |
| 2020 | $3,811 | $279,500 | $26,400 | $253,100 |
| 2019 | $3,717 | $274,000 | $19,200 | $254,800 |
| 2018 | $3,253 | $249,000 | $19,200 | $229,800 |
| 2017 | $2,910 | $189,000 | $17,500 | $171,500 |
| 2016 | $2,712 | $170,500 | $17,500 | $153,000 |
| 2015 | $2,705 | $162,000 | $17,500 | $144,500 |
| 2014 | -- | $152,500 | $20,300 | $132,200 |
Source: Public Records
Map
Nearby Homes
- 2922 Tyler St NE
- 2943 Taylor St NE
- 3049 Tyler St NE
- 1111 28th Ave NE
- 3050 Pierce St NE
- 2635 Polk St NE
- 2637 Taylor St NE
- 3227 Tyler St NE
- 2623 Polk St NE
- 1001 26th Ave NE
- 1000 26th Ave NE
- 1014 26th Ave NE
- 2628 Quincy St NE
- 3154 Lincoln St NE
- 813 26th Ave NE
- 3243 Pierce St NE
- 2730 Ulysses St NE
- 2807 Ulysses St NE
- 2619 Lincoln St NE
- 2827 Hayes St NE
- 2930 Tyler St NE
- 2918 Tyler St NE
- 2934 Tyler St NE
- 2938 Tyler St NE
- 2914 Tyler St NE
- 2919 Central Ave NE
- 2942 Tyler St NE
- 2910 Tyler St NE
- 2927 Tyler St NE
- 2921 Tyler St NE
- 2931 Tyler St NE
- 2906 Tyler St NE
- 2919 Tyler St NE
- 2935 Tyler St NE
- 2913 Central Ave NE
- 2913 Tyler St NE
- 2939 Tyler St NE
- 933 29th Ave NE
- 2950 Tyler St NE
- 2900 Tyler St NE