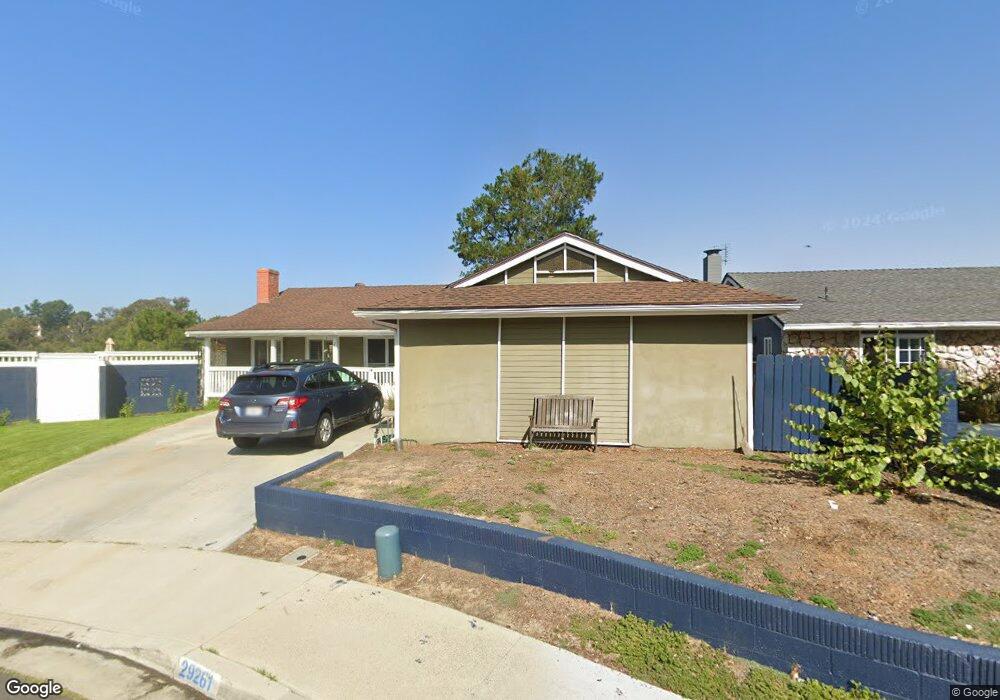
29261 Via San Sebastian Laguna Niguel, CA 92677
Estimated Value: $1,268,000 - $1,452,000
3
Beds
2
Baths
1,344
Sq Ft
$1,011/Sq Ft
Est. Value
About This Home
This home is located at 29261 Via San Sebastian, Laguna Niguel, CA 92677 and is currently estimated at $1,359,335, approximately $1,011 per square foot. 29261 Via San Sebastian is a home located in Orange County with nearby schools including Hidden Hills Elementary, Niguel Hills Middle School, and Dana Hills High School.
Ownership History
Date
Name
Owned For
Owner Type
Purchase Details
Closed on
Sep 29, 2021
Sold by
Kenney Matthew and Kenney Stephanie
Bought by
Kenney Matthew Richard and Kroese Stephanie Lynn
Current Estimated Value
Purchase Details
Closed on
Aug 25, 2000
Sold by
Thomas Mccanna and Thomas Barbara
Bought by
Kenney Matthew and Kroese Stephanie
Home Financials for this Owner
Home Financials are based on the most recent Mortgage that was taken out on this home.
Original Mortgage
$233,600
Interest Rate
7.9%
Purchase Details
Closed on
Apr 21, 1995
Sold by
Chenarides Arline and Wisehart Douglas Arline
Bought by
Mccanna Thomas and Mccanna Barbara
Home Financials for this Owner
Home Financials are based on the most recent Mortgage that was taken out on this home.
Original Mortgage
$161,100
Interest Rate
8.43%
Create a Home Valuation Report for This Property
The Home Valuation Report is an in-depth analysis detailing your home's value as well as a comparison with similar homes in the area
Home Values in the Area
Average Home Value in this Area
Purchase History
| Date | Buyer | Sale Price | Title Company |
|---|---|---|---|
| Kenney Matthew Richard | -- | None Available | |
| Kenney Matthew | -- | None Available | |
| Kenney Matthew | $292,000 | Orange Coast Title | |
| Mccanna Thomas | $179,000 | Fidelity National Title Ins | |
| Chenarides Arline | -- | Fidelity National Title Ins |
Source: Public Records
Mortgage History
| Date | Status | Borrower | Loan Amount |
|---|---|---|---|
| Previous Owner | Kenney Matthew | $233,600 | |
| Previous Owner | Mccanna Thomas | $161,100 | |
| Closed | Kenney Matthew | $43,800 |
Source: Public Records
Tax History Compared to Growth
Tax History
| Year | Tax Paid | Tax Assessment Tax Assessment Total Assessment is a certain percentage of the fair market value that is determined by local assessors to be the total taxable value of land and additions on the property. | Land | Improvement |
|---|---|---|---|---|
| 2025 | $4,313 | $439,987 | $343,623 | $96,364 |
| 2024 | $4,313 | $431,360 | $336,885 | $94,475 |
| 2023 | $4,220 | $422,902 | $330,279 | $92,623 |
| 2022 | $4,139 | $414,610 | $323,803 | $90,807 |
| 2021 | $4,058 | $406,481 | $317,454 | $89,027 |
| 2020 | $4,017 | $402,314 | $314,199 | $88,115 |
| 2019 | $3,936 | $394,426 | $308,038 | $86,388 |
| 2018 | $3,860 | $386,693 | $301,998 | $84,695 |
| 2017 | $3,783 | $379,111 | $296,076 | $83,035 |
| 2016 | $3,709 | $371,678 | $290,271 | $81,407 |
| 2015 | $3,652 | $366,096 | $285,911 | $80,185 |
| 2014 | $3,580 | $358,925 | $280,310 | $78,615 |
Source: Public Records
Map
Nearby Homes
- 29181 Via San Sebastian
- 24877 Nueva Vista Dr Unit 23
- 24839 Nueva Vista Dr Unit 5
- 24705 Queens Ct
- 24615 Kings Rd
- 25112 Armagosa Dr
- 25111 Adelanto Dr
- 24532 Kings View
- 24862 Vista Rancho
- 28793 El Adolfo
- 28645 Via Pasatiempo
- 29592 Los Osos Dr
- 28621 Rancho Del Sol
- 29282 Rue Cerise Unit 7
- 28721 Placida Ave
- 1 O'Hill
- 24515 El Sorrento
- 24625 Los Serranos Dr
- 29901 Weatherwood
- 24822 Cutter
- 29271 Via San Sebastian
- 29251 Via San Sebastian
- 29241 Via San Sebastian
- 29262 Via San Sebastian
- 29252 Via San Sebastian
- 29231 Via San Sebastian
- 29242 Via San Sebastian
- 29221 Via San Sebastian
- 24871 Monte Verde Dr
- 29232 Via San Sebastian
- 24861 Monte Verde Dr
- 24881 Monte Verde Dr
- 29211 Via San Sebastian
- 29222 Via San Sebastian
- 29212 Via San Sebastian
- 24891 Monte Verde Dr
- 29201 Via San Sebastian
- 29202 Via San Sebastian
- 24901 Monte Verde Dr
- 24872 Monte Verde Dr