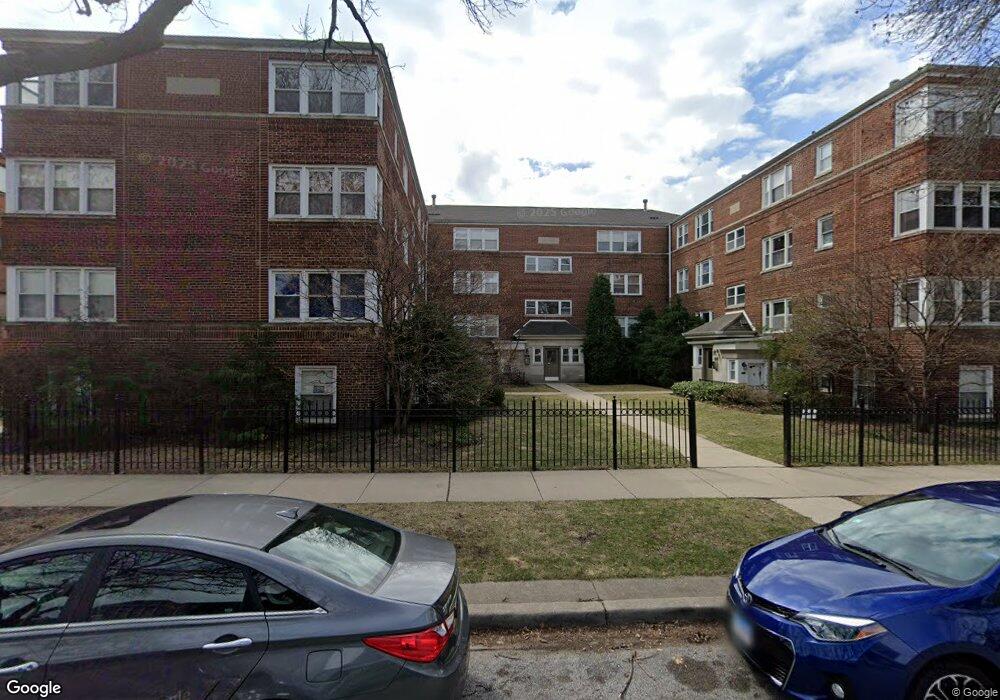
2927 W Summerdale Ave Unit 2927 Chicago, IL 60625
Lincoln Square NeighborhoodEstimated Value: $222,000 - $302,000
2
Beds
1
Bath
1,100
Sq Ft
$230/Sq Ft
Est. Value
About This Home
This home is located at 2927 W Summerdale Ave Unit 2927, Chicago, IL 60625 and is currently estimated at $253,188, approximately $230 per square foot. 2927 W Summerdale Ave Unit 2927 is a home located in Cook County with nearby schools including Jamieson Elementary School, Amundsen High School, and North Shore Adventist Academy.
Ownership History
Date
Name
Owned For
Owner Type
Purchase Details
Closed on
Mar 21, 2016
Sold by
Reese Kylene M
Bought by
Martinez Otniel R
Current Estimated Value
Home Financials for this Owner
Home Financials are based on the most recent Mortgage that was taken out on this home.
Original Mortgage
$164,900
Outstanding Balance
$135,556
Interest Rate
4.87%
Mortgage Type
New Conventional
Estimated Equity
$117,632
Purchase Details
Closed on
Jun 23, 2010
Sold by
Mcmahon Michael and Frye Kimberly Lynn
Bought by
Reese Kylene M
Home Financials for this Owner
Home Financials are based on the most recent Mortgage that was taken out on this home.
Original Mortgage
$166,250
Interest Rate
4.83%
Mortgage Type
New Conventional
Purchase Details
Closed on
Mar 12, 2003
Sold by
Summerdale Court Llc
Bought by
Mcmahon Michael
Create a Home Valuation Report for This Property
The Home Valuation Report is an in-depth analysis detailing your home's value as well as a comparison with similar homes in the area
Home Values in the Area
Average Home Value in this Area
Purchase History
| Date | Buyer | Sale Price | Title Company |
|---|---|---|---|
| Martinez Otniel R | $170,000 | None Available | |
| Reese Kylene M | $175,000 | Stewart Title Guaranty Co | |
| Mcmahon Michael | $191,500 | -- | |
| Mcmahon Michael | $191,500 | -- |
Source: Public Records
Mortgage History
| Date | Status | Borrower | Loan Amount |
|---|---|---|---|
| Open | Martinez Otniel R | $164,900 | |
| Previous Owner | Reese Kylene M | $166,250 |
Source: Public Records
Tax History Compared to Growth
Tax History
| Year | Tax Paid | Tax Assessment Tax Assessment Total Assessment is a certain percentage of the fair market value that is determined by local assessors to be the total taxable value of land and additions on the property. | Land | Improvement |
|---|---|---|---|---|
| 2024 | $2,465 | $19,249 | $2,988 | $16,261 |
| 2023 | $2,382 | $15,000 | $2,421 | $12,579 |
| 2022 | $2,382 | $15,000 | $2,421 | $12,579 |
| 2021 | $2,346 | $14,999 | $2,420 | $12,579 |
| 2020 | $2,391 | $13,834 | $1,437 | $12,397 |
| 2019 | $3,093 | $15,397 | $1,437 | $13,960 |
| 2018 | $3,041 | $15,397 | $1,437 | $13,960 |
| 2017 | $2,958 | $13,740 | $1,286 | $12,454 |
| 2016 | $2,752 | $13,740 | $1,286 | $12,454 |
| 2015 | $2,518 | $13,740 | $1,286 | $12,454 |
| 2014 | $2,380 | $12,825 | $1,134 | $11,691 |
| 2013 | $2,333 | $12,825 | $1,134 | $11,691 |
Source: Public Records
Map
Nearby Homes
- 2946 W Balmoral Ave
- 2829 W Farragut Ave Unit 2E
- 2900 W Foster Ave
- 2745 W Berwyn Ave
- 2710 W Summerdale Ave Unit GA
- 2712 W Balmoral Ave Unit 2E
- 5501 N California Ave Unit 1N
- 2700 W Balmoral Ave
- 2910 W Gregory St
- 2434 W Bryn Mawr Ave
- 2637 W Catalpa Ave
- 2800 W Bryn Mawr Ave
- 5624 N Francisco Ave
- 2700 W Carmen Ave
- 2626 W Catalpa Ave Unit 21
- 2620 W Catalpa Ave Unit 1A
- 5220 N Rockwell St Unit 1S
- 5353 N Sawyer Ave
- 5646 N Francisco Ave
- 2601 W Foster Ave Unit 3S
- 2921 W Summerdale Ave Unit 2921
- 2925 W Summerdale Ave Unit 2925
- 2925 W Summerdale Ave Unit 2925
- 2921 W Summerdale Ave Unit 2921
- 2927 W Summerdale Ave Unit 2927
- 2927 W Summerdale Ave Unit 2927
- 2925 W Summerdale Ave Unit 2925
- 2921 W Summerdale Ave Unit 2921
- 2925 W Summerdale Ave Unit 2925
- 2921 W Summerdale Ave Unit 2921
- 2921 W Summerdale Ave Unit 1
- 2925 W Summerdale Ave Unit 2D
- 2925 W Summerdale Ave Unit 2
- 2921 W Summerdale Ave Unit 2
- 2921 W Summerdale Ave Unit G
- 2921 W Summerdale Ave Unit 3
- 2927 W Summerdale Ave Unit 1
- 2923 W Summerdale Ave Unit 1
- 2923 W Summerdale Ave Unit 2923
- 2923 W Summerdale Ave Unit 2923