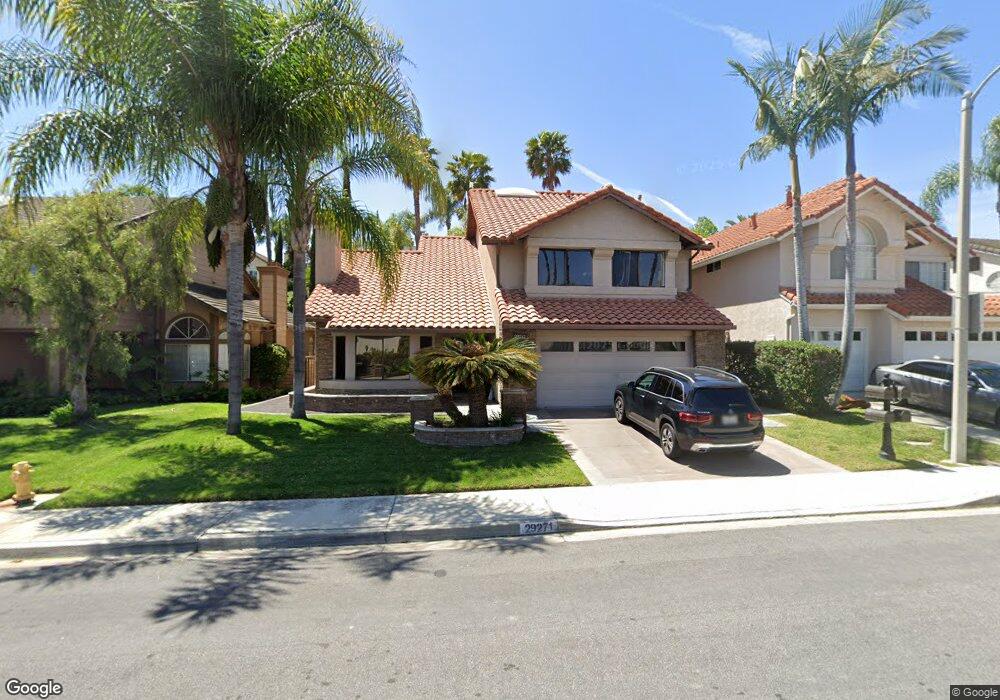
29271 Alfieri St Laguna Niguel, CA 92677
Estimated Value: $1,623,001 - $1,937,000
4
Beds
3
Baths
2,818
Sq Ft
$637/Sq Ft
Est. Value
About This Home
This home is located at 29271 Alfieri St, Laguna Niguel, CA 92677 and is currently estimated at $1,795,000, approximately $636 per square foot. 29271 Alfieri St is a home located in Orange County with nearby schools including Moulton Elementary, Aliso Viejo Middle School, and Aliso Niguel High School.
Ownership History
Date
Name
Owned For
Owner Type
Purchase Details
Closed on
Aug 23, 2000
Sold by
Sophie Fahimy
Bought by
Fahimy Fred
Current Estimated Value
Home Financials for this Owner
Home Financials are based on the most recent Mortgage that was taken out on this home.
Original Mortgage
$324,000
Interest Rate
8.29%
Purchase Details
Closed on
Aug 8, 2000
Sold by
Fahimy Fred
Bought by
Fahimy Fred and Fahimy Sophie
Home Financials for this Owner
Home Financials are based on the most recent Mortgage that was taken out on this home.
Original Mortgage
$324,000
Interest Rate
8.29%
Purchase Details
Closed on
Mar 27, 1996
Sold by
Michael Morand H and Michael Suzanne L
Bought by
Fahimy Fred and Fahimy Sophie
Create a Home Valuation Report for This Property
The Home Valuation Report is an in-depth analysis detailing your home's value as well as a comparison with similar homes in the area
Home Values in the Area
Average Home Value in this Area
Purchase History
| Date | Buyer | Sale Price | Title Company |
|---|---|---|---|
| Fahimy Fred | -- | California Counties Title Co | |
| Fahimy Fred | -- | Lawyers Title Company | |
| Fahimy Fred | $330,000 | Continental Lawyers Title Co |
Source: Public Records
Mortgage History
| Date | Status | Borrower | Loan Amount |
|---|---|---|---|
| Previous Owner | Fahimy Fred | $324,000 |
Source: Public Records
Tax History Compared to Growth
Tax History
| Year | Tax Paid | Tax Assessment Tax Assessment Total Assessment is a certain percentage of the fair market value that is determined by local assessors to be the total taxable value of land and additions on the property. | Land | Improvement |
|---|---|---|---|---|
| 2025 | $5,350 | $537,461 | $214,183 | $323,278 |
| 2024 | $5,350 | $526,923 | $209,983 | $316,940 |
| 2023 | $5,237 | $516,592 | $205,866 | $310,726 |
| 2022 | $5,138 | $506,463 | $201,829 | $304,634 |
| 2021 | $5,039 | $496,533 | $197,872 | $298,661 |
| 2020 | $4,988 | $491,442 | $195,843 | $295,599 |
| 2019 | $4,891 | $481,806 | $192,003 | $289,803 |
| 2018 | $4,797 | $472,359 | $188,238 | $284,121 |
| 2017 | $4,703 | $463,098 | $184,548 | $278,550 |
| 2016 | $4,613 | $454,018 | $180,929 | $273,089 |
| 2015 | $4,543 | $447,199 | $178,212 | $268,987 |
| 2014 | $4,456 | $438,439 | $174,721 | $263,718 |
Source: Public Records
Map
Nearby Homes
- 29312 Kensington Dr
- 29254 Alfieri St
- 29486 Pelican Way
- 28891 Drakes Bay
- 29494 Port Royal Way
- 29372 Christiana Way Unit 51
- 29141 Bobolink Dr
- 29712 Ellendale Dr
- 29522 Seriana
- 28661 Point Loma
- 23706 Sea Breeze Ln Unit 1
- 23653 Lexington Ct Unit 2
- 7 Sierra Vista
- 23231 Cheswald Dr
- 29632 Seriana
- 29931 Happy Sparrow Ln
- 1 O'Hill
- 29981 Running Deer Ln
- 30052 Happy Sparrow Ln
- 24306 Hillview Dr
- 29261 Alfieri St
- 29281 Alfieri St
- 29251 Alfieri St
- 29291 Alfieri St
- 29272 Kensington Dr
- 29266 Alfieri St
- 29301 Alfieri St
- 29282 Kensington Dr
- 29241 Alfieri St
- 29292 Kensington Dr
- 29262 Kensington Dr
- 29286 Alfieri St
- 29264 Alfieri St
- 29305 Alfieri St
- 29231 Alfieri St
- 29252 Alfieri St
- 29296 Alfieri St
- 29262 Alfieri St
- 29302 Kensington Dr
- 29252 Kensington Dr