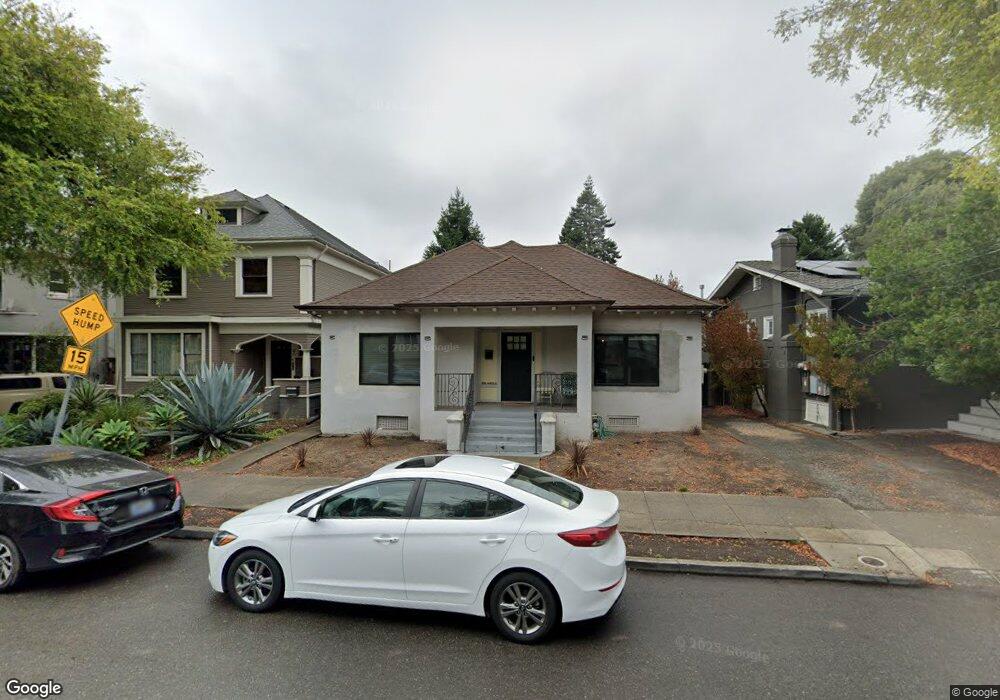
2928 Harper St Berkeley, CA 94703
South Berkeley NeighborhoodEstimated Value: $576,301 - $945,000
1
Bed
1
Bath
654
Sq Ft
$1,208/Sq Ft
Est. Value
About This Home
This home is located at 2928 Harper St, Berkeley, CA 94703 and is currently estimated at $790,325, approximately $1,208 per square foot. 2928 Harper St is a home located in Alameda County with nearby schools including Malcolm X Elementary School, Emerson Elementary School, and John Muir Elementary School.
Ownership History
Date
Name
Owned For
Owner Type
Purchase Details
Closed on
Nov 2, 2015
Sold by
Jackson Chappell and Jackson Janet
Bought by
The Chappell Jackson & Janet Brandt Jack
Current Estimated Value
Purchase Details
Closed on
Oct 9, 2015
Sold by
Blue Brenda
Bought by
Jackson Chappell and Jackson Janet
Create a Home Valuation Report for This Property
The Home Valuation Report is an in-depth analysis detailing your home's value as well as a comparison with similar homes in the area
Home Values in the Area
Average Home Value in this Area
Purchase History
| Date | Buyer | Sale Price | Title Company |
|---|---|---|---|
| The Chappell Jackson & Janet Brandt Jack | -- | None Available | |
| Jackson Chappell | -- | None Available |
Source: Public Records
Tax History
| Year | Tax Paid | Tax Assessment Tax Assessment Total Assessment is a certain percentage of the fair market value that is determined by local assessors to be the total taxable value of land and additions on the property. | Land | Improvement |
|---|---|---|---|---|
| 2025 | $5,101 | $295,941 | $88,782 | $207,159 |
| 2024 | $5,101 | $290,140 | $87,042 | $203,098 |
| 2023 | $4,988 | $284,451 | $85,335 | $199,116 |
| 2022 | $4,887 | $278,874 | $83,662 | $195,212 |
| 2021 | $4,887 | $273,407 | $82,022 | $191,385 |
| 2020 | $4,615 | $270,604 | $81,181 | $189,423 |
| 2019 | $4,419 | $265,300 | $79,590 | $185,710 |
| 2018 | $4,338 | $260,100 | $78,030 | $182,070 |
| 2017 | $4,165 | $255,000 | $76,500 | $178,500 |
| 2016 | $4,015 | $250,000 | $75,000 | $175,000 |
| 2015 | $1,126 | $14,280 | $4,488 | $9,792 |
| 2014 | $1,098 | $14,000 | $4,400 | $9,600 |
Source: Public Records
Map
Nearby Homes
- 2926 Ellis St
- 1646 Ashby Ave
- 2045 Emerson St
- 1535 Julia St
- 2057 Emerson St
- 2727 McGee Ave
- 2701 Grant St
- 3110 California St
- 3114 California St
- 1530 Stuart St
- 2110 Ashby Ave
- 3138 California St
- 1507 Prince St
- 3233 Ellis St
- 3101 Sacramento St
- 2124 Prince St
- 3214 California St
- 6555 Shattuck Ave
- 1612 Carleton St
- 2790 Sacramento St
Your Personal Tour Guide
Ask me questions while you tour the home.